This update will go over the newer concepts for design/build on a civil site.
These concepts have done a lot for large roads and in the vertical world where tenant build outs change daily. Generally, engineers that do not have enough staff and are worn down will welcome input from you and your staff. There are several considerations you need to address for this type of relationship.
Beware of a CMAR (Construction Manager at Risk) projects. They can be profitable but need to be fully vetted on the front end. Change orders are usually not an option. These contracts are an effort by the owner to get fixed price work so know what the project entails.
For the civil portion of a project that is done in close contact with engineers and owners, things can go fast. Changes are easily approved, so be sure you propose answers. After all, this is a team job, and you will be tasked with solutions that keep the job on schedule and budget.
Money becomes more transparent. The billing is at cost plus, or a fee above agreed upon operating and materials costs. It’s not a problem, just a different approach to billing and verifying pricing. Price increase adjustments for material cost increases need to be included.
We have all been there. Get a set of plans, open them, take a look, and wonder what possessed the team responsible to perform the way they did. I started my career in the offices of a developer/builder. I got to see firsthand how the process goes, as well as the changes that must happen. The journey often ends up with something completely different than originally planned.
Development Types
There are two types of builder groups; public and private. For this discussion we will look at private work. Private work can be further broken down into commercial and local. This article covers commercial builders.
Commercial Development
In the civil construction world, commercial development relates to projects done by a large company in different geographic areas. Think of a big box store or restaurant.
Here are some general specifications:
They have centralized operations and often work on sites they may never visit.
Their staff does a lot of projects. Operations are streamlined and efficient. When they get busy, questions can sometimes take too long to get answered.
They have little emotional investment in the process.
Deadlines and opening dates are the only thing that matters. I have seen corporate firms do full redesigns to placate local building officials without blinking an eye.
They are not afraid to spend money to get things done. The fast-track construction concept came about just for big box retail.
They are not used to dealing in your area. Try not to suggest, “we do it this way around here.”
Junior people handle stuff first. Get used to clearly explaining an issue so the next person up the ladder has all pertinent data.
The Process
The biggest factor in commercial work is the time from land acquisition to opening day. Pay and bonuses for employees involved are measured by expediency of their work. A month delay for a big retailer translated into hundreds of thousands of dollars in lost revenue. They still have a bottom line. Quick decisions to problems are important to keep in mind.
Over 15 years ago, I wrote an article for a magazine that included the thought, “all the good dirt is gone.” The nice flat building sites with well compacted soil and no garbage were all developed and all that is left is the stuff that is expensive and difficult to work with. The land is acquired by the company and the process begins. For this part, both commercial and private work follow the same course.
The selection of an engineering firm takes one of two roads. The company has a nationally registered firm, meaning they have people with a license in each state they work in. The other track is to contact a local firm that has experience in the area to get things going. I have not seen much difference in the choice. An advantage of a local firm is that if you get the job, communication could be smoother.
Next, a survey of the property is performed and submitted to the engineer and owner. These will be ALTA Surveys. This means they conform to the American Land Title Association guidelines that follow strict standards for real estate transactions. I remember a job involving a McDonald’s restaurant in Las Vegas that had three surveys performed to verify the plot. The land was priced by the square foot, so every little bit made a difference for all involved.
The survey is just 2D and clearly outlines the property boundary. At the same time, a topography map is usually made to provide the engineer with a starting point.
Site Specifics
We all know what a Wal-Mart or Home Depot looks like. When it comes to the area surrounding the building, this is where things must conform to the site purchased. The process being backwards, at least to us civil types. The footprint of the building is decided. How big a structure needs to be built to supply the anticipated traffic. From there, the civil engineer takes the job. There are fixed and fluid variables that enter into the site design equation, and many of them are decided by local codes.
Drainage needs to be sorted first. Knowing how big the building is, how much of the project do we need to dedicate to drainage? Most local codes will let you work in cubic feet of storage, meaning deeper basins that take up less area. Some require a percentage of the site have allocated green space, which also can be retention basins.
Number of parking spaces may be called out by ordinances. Handicap spaces are also controlled that way. This is the reason you may see a lot of accessible spaces in some parking areas and not many in others. Local codes adjust that. The only requirement is they do not allow less density than the ADA guidelines outline.
Access is next. We would love every entry to have a nice long decel lane, wide access driveways, and plenty of entrances and exits. The site will restrict this as well as the roads they enter.
The owner and engineers will need to look at the aesthetics and curb appeal of the project. Nobody wants to enter an unwelcoming site. Green space, trees, and easy access are all key.
There is no such thing as a great parking lot design. All ideas have drawbacks. Make something easy to navigate and somebody will find a way to gum things up. Useable area has the biggest impact on one way or two-way lot lanes, nothing else.
With these less than desirable plans in your hands, you bid the job. The hard bid was won, and it is time to work. I have seen many a small to medium contractor do a bang-up job for an owner and get asked to do more on a negotiated basis. Keep that in mind when you look at this type of work.
My best advice is to submit your concerns right after being rewarded the job. You already have the list of concerns that was made during the takeoff, estimate, and bid where contradictions and confusing details were presented in the plans so this should be easy. Addressing concerns at the start will accomplish two goals, it shows that you’ve studied the plans well and gives you the chance to bail if you do not like their answers.
Change orders are normal. Do not hesitate to fully explain the problem and solution. Your submission will most likely pass through two or three people before it gets approved.
Fully explain the issue requiring the change order.
Propose a fix and the cost associated. Remember, never ask a question without providing your own best answer.
Make your submittal stand on its own. In other words, if I read your change request and have any questions, you did not do your job well enough.
Site selection, design and construction are all handled by different people. Seldom does one person follow a project through. Make sure everything is written down. Communicate with all stakeholders so that there is no misunderstanding when things get handed off.
Update: May 12, 2022 – I got some questions after posting this article to address. As always, do not hesitate to contact me with questions.
A common mistake, “I always use the surface from the engineer and things work fine”.
Let me unpack this and discuss the reasons why you should never trust a surface you did not build.
You are one of the lucky few who’s engineer actually understands the 3D world. This is the exception and not the rule.
Your expectations are low. Maybe you do not have machine control. You also could think that machine control just gets you close and final grading has to be done by an experienced blade hand. If your model cannot go into a machine and cut a good grade, it’s time to up your game.
The job may be dynamic. In other words, changes are happening so fast, the engineer actually pays attention to the model and gives you portions to work on that are close enough to get things right.
The bottom line is you don’t know what you don’t know. When an “OK” model is all that is ever delivered to the field, everyone assumes that is as good as it gets. One of the biggest sources of new business for us is when someone from one of our client companies moves to a firm that has substandard data. They point out the issues of the data and point out the advantage of quality work.
There are many reasons you may be compelled to do a quick fix on a bad surface and get it in the field. We never use an engineer’s surface sent with CAD files because we are being paid to build it correctly. From a time-management standpoint, we can build a surface faster than the time it takes to break it apart, find the issues, and put it back together. When someone finally gets the files, and crews have been on the job for three weeks, a quick (and very dirty) surface turned around overnight is better than nothing.
Everybody talks about only sending out “perfect” models. My hat’s off to you, most jobs do not get enough warning to make them pretty from the start. I am speaking of the people in the office who get the call four minutes after the CAD files hit everyone’s inbox and the voice on the other end is wondering where the model is. That is the reality we deal with. Time to figure how to make this work.
The Surface Defined
When I talk about a surface, we are looking at the 3D elements that are elevated to make a model, contours, 3D lines, and points. Surfaces can be any combination of these three things. I will go through the advantages of each data type for a quick surface and what they do (alone or with other elements) to get you moving.
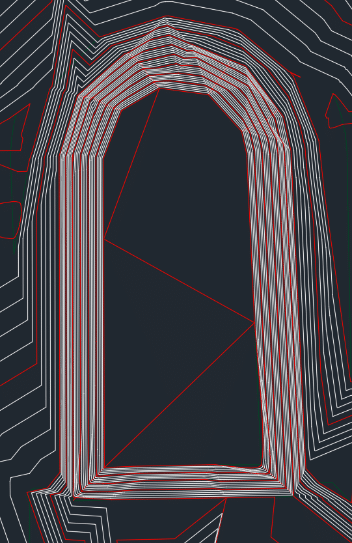
Contours
Contours are referred to as 2D lines because they are all the same elevation and still 3D because they are part of a surface. Contours undergo a lot of changes during data production but are often a quick way to get something out.
Initially, these contours do not look so bad. You need to trust me; they are a decent representation of the surface.
Creating a quick surface shows there are some problems. In this case we cannot send this out, work needs to be done. This may be considered work that takes too long for a quick start, but the spikes and bad information will cause more issues than they fix.
Line density is all over the place. Some areas have long runs without anything and it is too dense in other spots. This is common for a civil 3D file.
It needs break lines in order to make sense. A ditch is being blown over and slopes are not smooth and even.
Here is a screen shot of the improved density and some spike removal. At some point, you need to decide what a contour only surface should have. Here are some thoughts:
This is for rough grading only. You will not get detail to get you within a half-foot, do not even try.
Ditches and berms are easily flattened and there is no simple way to verify their existence. You need to go through the model and see if each high and low area look good.
At the right is a mess that should be a nice retention area.
Streets from contours are a hot mess. That may be fine for a new subdivision road but not for a rehab project or lane additions; those are usually close to grade to start, and you may make a bigger mess doing a quick surface. You need better.
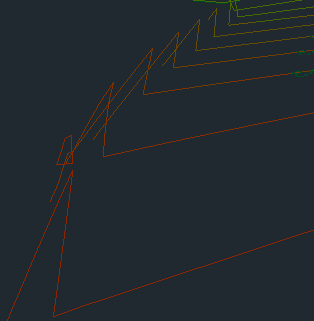
Linking contours with break lines can solve some issues. The problem is they take time to draw and auto functions can make the cleanup harder than just connecting the dots yourself.
In this image the problem is with roadway contours. The triangles will link in a bad way and make a surface that not only looks bad but does not perform. There are no real easy ways out of the issue except to connect them with 3D lines.
Edge of pavement CAD lines can sometimes be elevated as they cross the contours. The straight segments created by the function can cause crossing line and new headaches.
Any of the three lines that make up the road, (edge of pavement, face of curb, and top back of curb) can be drawn and then offset to get things closer. The problem can spike when elevations do not match between contours and 3D lines.
One can argue that it is just a starter file, and this is too much detail. However, this can become a problem when there is not much dirt to move, and crews need more exact information.
3D Lines
Contours have one elevation their entire length. 3D lines vary in elevation and are the best way to create curbs and other road and parking lot features. Files from engineers are usually not loaded with these lines. About the only time I see them are as break lines inserted to contain features that might have been blown over during design. Without any real 3D lines to look at or adjust, you will need to make your own.
Any time I go to the effort of drawing 3D lines, I make sure all the elements I am connecting are correct. Because of this, I only use them to tame bad spots in a quick model and not for beauty. More detail will be added later when we make the actual finished grade model.
After trying not to draw break lines, the field may finally compel you to clean things up a bit to get closer to the real finish.
Building pads benefit from a few quick lines to make a fence around the single elevation.
Retention areas can benefit from a little cleanup by installing lines on corners and bottoms. These are usually the first thing done on a site so that makes sense.
Large sheet graded areas are the first to go as well. They are not too hard to do so you can get a jump on the field by making these look nice while drilling down when building the hard stuff.
The retention to the right looks better with some break lines. It still needs some more and the northwest corner is in the dumpster.
Points
When doing a quick repair on a bad model, points usually never enter the picture. There are times when they will come in handy though.
When you have utilities to install, structure elevations shown as center.
Any existing utilities and bends that can be noted by points can save a mess. 2D or, 3D is better if possible, will come in handy in the field.
If you have control points, include them on the screen as well as a text file to upload to the data collector for an easier calibration.
Surface File
Sometimes you won’t get the pieces used to make up a surface, you just get the triangles. With Civil 3D files opened in that program, the individual parts can be extracted as well as other important data to make the job of the model from the engineers clean up easier. When all you have to work with is a mass of triangles, you do not have a lot of options for greatness.
Trimble Business Center will keep your changes to 3D faces when regenerating a surface.
Carlson will make a new model; preservation of swapped faces is some work. It involves saving your changes and incorporating them into the new model.
Do not be worried about removing faces and adding break lines to an engineer’s surface. Civil 3D has a lot of settings, usually CAD technicians get their finger stuck on the “make a lot of triangles” button.
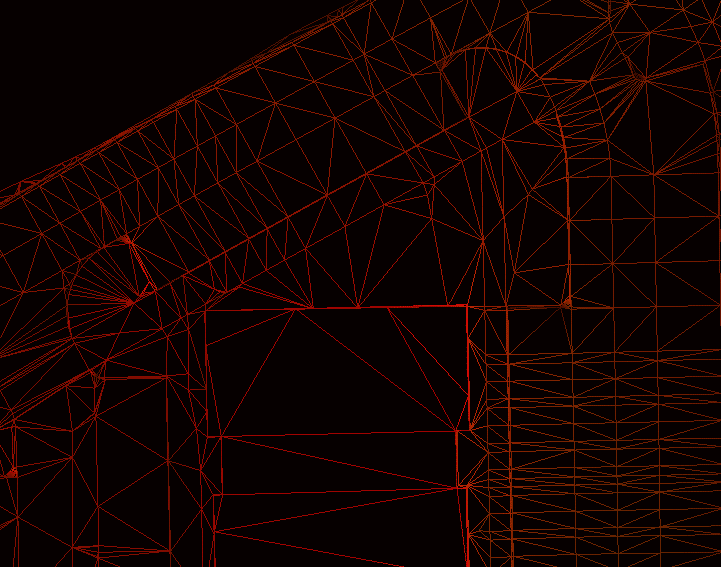
The surface on the right is not too bad. There are areas that could be improved. This may be okay to start the job but will have to be improved to make the grade.
Here is that same general area as a finished grade model ready to work. Better triangle density and smoother contours on a gut check let us know this will do the job.
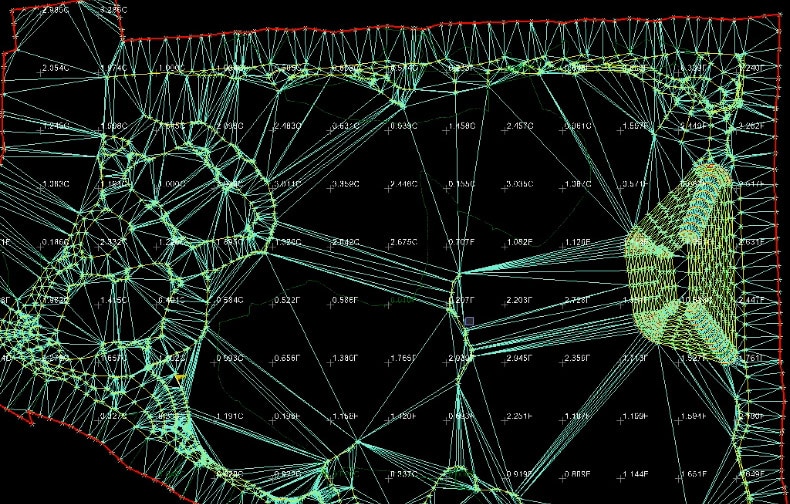
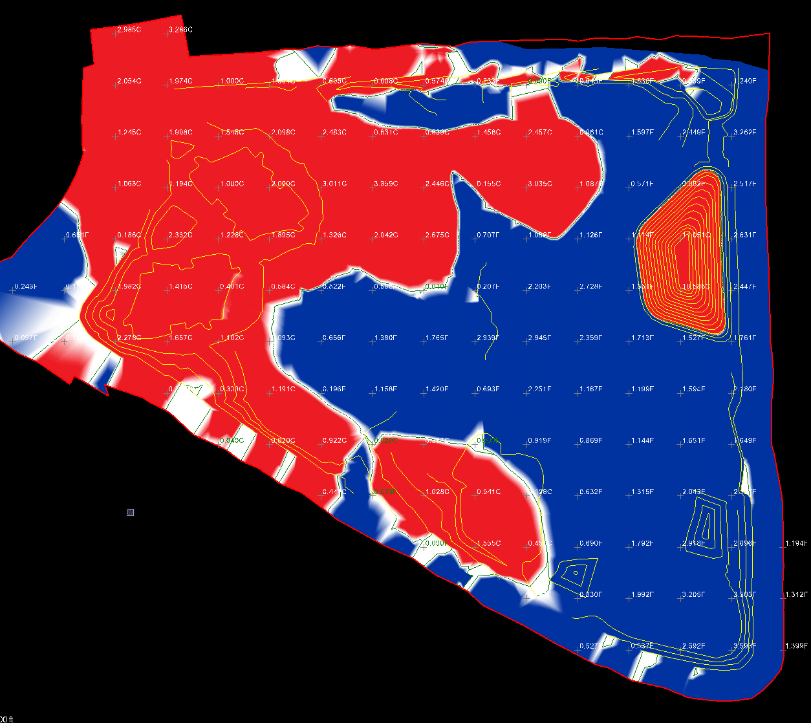
An Experiment
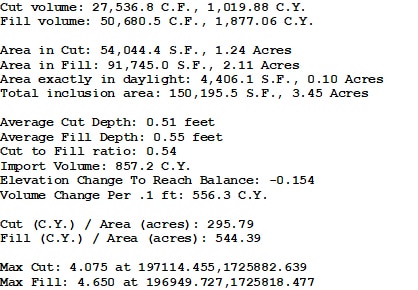
I performed a takeoff from an engineer’s surface that consisted of 3D faces against our model. Here are the results:
Important notes
This is a small area at about 3.5 acres and there is a lot happening in a little spot.
There is a couple thousand-yard discrepancy in the dirt numbers.
The max cut and fill is 4-feet each. Their model is considerably different than ours.
Summary
“We need it now” is all too common with the fast-track world we live in. I do not want to see people waiting to deploy technology on a job. I also do not want to see dirt moved twice because somebody got a model that had too many issues. A balance must be struck. It is our job to be sure that what goes out quickly is not going to cause extra work. Be careful and check what you are sending. It is better to have the field complain they have no model than a bunch of rework.
We all want all jobsite data available to us in a grading model. I have always contested that 10 minutes at the computer is about 30 minutes in the field balled up in the truck with a calculator. We do as much as is requested for a job, but we will also not waste your money when it’s not cost effective or better to be done in the field. In this offering, we look at both scenarios to show what a good model and related details can look like.
Demolition
It’s good to have detailed information on the areas of a project that are slated for removal. However, we need to be careful because the quality of the information can cause more problems than cures. The first step is to get the CAD files from the existing conditions and send them to the field for comparison. If the 2D linework is an exact match, it would then be okay to let the work get to the field for demolition. Keep in mind, this only works for what is visible. I try not to trust the sub-surface drawing data and usually exclude it. We have seen too many pipes that do not follow a straight line and are broken when digging.
What to trust? Always be careful when supplying existing conditions to the field
Now that we have a solid trust in the plans for demolition, what is the procedure and deliverables?
2D linework initially goes to the field for verification.
Take point shots to confirm plan views.
3D points will help to update the demolition plans.
Be aware of amounts and locations for demolition. If something is missed, now is the time to document and get a change order started.
Incorporate the 3D shots into your demolition file.
Update the existing utility locations as you go along. They will be part of the as-builts.
Model Basics
There will be some confusion as to what constitutes a model and what is extra and may not be needed. For sites, I have seen just building pads and retention areas. The model builder for the contractor thought it was best to work out the parking lot in the field. When we are asked to do “the usual stuff” for a civil site, here is what you will get:
All pads to requested grade. Some people like finish slab height while others want top of stone base.
Retentions to requested grade. There will sometimes be liners, clay or topsoil added later so we might do a retention subgrade.
Parking lot to finished grade. We use finished grade in the model for two reasons; it’s easy to dial down to subgrade and when you need to reference plans for grades you avoid possible math errors to guess subgrade. It is also easier to offset the parking lot slope to grade 2-feet behind back of curb for a machine to pour.
Curb layout can be lines and/or points at top back of curb as well as offsets. More on that later.
Offsites are a wildcard. If we get grades for deceleration lanes and approaches, we will enter them. Usually, we will want some existing grade shots to confirm. This is important when there is a sawcut and we need to make a lane, gutter, and curb to flow correctly.
Utilities are an option. We provide surface inlets, grates, and manholes but pipe and structures can be added for contractors who self-perform.
With this information the contractor can get a job to the point of completion while working with a surveyor. All information should be available to the engineers, surveyors, and forward-thinking municipalities. We often send out different file types for various programs used by those other than our client.
I usually find that when contractors get comfortable with this technology, they start thinking beyond the basic model. I have always tried to leverage the power we now have. With that, we are always able to improve the use of GPS surveying and related equipment to make things quicker and reduce re-work. The options that follow are a welcome sight to an experienced user. New users will feel like they are drinking from the fire hose. Be cautious when getting new users up to speed. A more basic surface model and less linework can make the process easier.
More Information
I need to caution the reader here. With additional information comes added responsibility. When you leave the basic model and start adding on, this results in extra layers, more surfaces, and various points files. All this needs to be managed and kept current. Before stepping off and getting into these weeds, make sure you have file flow dialed in.
Every surface and linework file must have a date. It makes it easier to identify the most current information is being used.
Use a cloud-based service for field files. Set it to notify involved parties that new files are available. This makes it easy to know when new files arrive. Without this setting, remote workers waste time checking the folders or could potentially use outdated information.
Have one person in the office be responsible for updating. They will also keep the field in touch with changes and next steps.
Additional Surfaces
When doing added work, it’s sometimes easier to just make a new surface. Here are some examples:
A large excavation for a basement or underground parking. We will often build ramps and haul roads for mass excavation. This allows the haul roads to be cleaned on a regular basis for high-speed scrapers. Smooth ramps and roads save beat up machines.
Pad blowups. If there are a lot of sidewalk and grading details near a building, we will build a separate surface for a pad. This red line shows where the 5-foot blowup will go for the building. There are a lot of bump-outs on the slab and it will actually be built as simply as possible. We will make a surface to reflect this. It also provides the contractor with the amount of rock and select fill as they now have the square footage of the enlarged pad area.
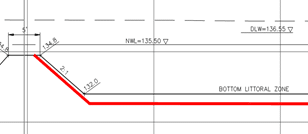
Retentions with specific subgrades usually need another surface. The reason is that the final size is critical and often these have steps in the subgrade but need to be smooth for finish.
The job here had a deeper subgrade in the botton than the sides. It would have been difficult to just make a finished grade model or only a subgrade. Always look at the time it takes to do a quick in-progress model as opposed to having to work things out in the field.
Curb Offsets
Whenever we are asked to do curb offsets, there needs to be a clear idea what we are after for production. Here are the options we usually perform.
Additional layout line. This is a Top Back of Curb (TBC) line we add to a model for layout. The offset allows the contractor to know the height of the TBC without having to disturb the actual curb location. This is good for setting stringline and installing hanging forms.
Top Back of Curb (TBC) Surface. We will make an additional surface that represents the TBC elevation and a specified offset. This allows the field to walk (usually 3-feett) wide surface that is the TBC elevation for layout and checking. Always make this a separate surface, otherwise it will make a mess of the grading model if you don’t.
Layout points. We provide 3D so we can layout the curve PC, PT, and radius points. Also provided are points along the straight lines for grade checking and string setup.
There are a lot more things that can be done with a little imagination. Look for more ideas in the upcoming blog articles. We do a lot of specialty work that may help you someday.
Building information modeling (BIM) has established itself as a useful process for architects and construction teams over the past two decades, as it allows users to create intelligent 3D models that include every detail of a building. This process also enables you to document management, coordination and simulation throughout your project’s life cycle, which includes planning, designing, construction, operation and maintenance.
Below, you’ll learn more about the evolution of BIM, one of the most important chapters in the history of construction. This story is a complex narrative that involved the U.S., Western Europe and a set of Soviet countries competing with each other to develop a flawless architectural solution to replace 2D workflows.
BIM was a concept long before the technology was advanced enough to make it a reality. Notable early events in the history of modeling include the following.
Engelbart’s Vision
The conceptual foundations of BIM technology date back to the 1960s, when computing was still in its infancy.
In the paper Augmenting Human Intellect, engineer and inventor Douglas C. Engelbart provided his vision of the future. He stated that architects could begin designing a structure just by entering a series of data and specifications — for example, a 5-inch slab floor, 8-inch concrete wall and so on. As they began designing the structure, they could look at the model and adjust the parameters.
Solid Modeling Programs
In the 1970s and 1980s, solid modeling programs emerged. The two primary methods these programs used to display and record shape information were:
Constructive solid geometry (CSG): CSG uses numerous simple shapes that can either be solids or voids. The shapes can combine and intersect, subtract or combine, resulting in what appears to be more complex forms.
Boundary representation (BREP): Boundary representation, defines objects using their spatial boundaries by detailing the edges, points and surfaces of a volume.
Charles Eastman and the Building Description System
In the 1970s, architect and computer scientist Charles Eastman designed a project called the Building Description System (BDS). This program featured a graphical user interface, perspective and orthographic views and a database you could use to retrieve elements and add them to your model. These elements could be sorted into categories such as supplier and material type.
Eastman said this system would lower the cost of design through its efficiencies in analysis and drafting. However, most architects at the time could not use the software, and it is not even known if any projects were made using the program. However, BDS was notable because it identified some of the biggest issues architectural design would tackle over the next five decades.
Evolution of Modeling Technologies
3D modeling in construction saw major advancements in the 1980s with new features like temporal phasing and graphical analysis. Technologies like this made it easier for professionals to model construction equipment in their building projects.
Temporal Phasing
In the early 1980s, several systems developed in the U.K. gained traction and were used for construction projects. One notable system was RUCAPS, the first program to feature temporal phasing. It was useful in the phased construction of Terminal 3 of London’s Heathrow Airport.
In 1988, the Center of Integrated Facility Engineering was developed at Stanford, which was a major landmark in the evolution of BIM. It led to the development of 4D models with time attributes for building.
Simulations and Graphical Analysis
In 1993, Lawrence Berkeley National Lab started developing the Building Design Advisor, which would perform simulations using an object model of a structure and its context. This software was among the first to integrate simulations and graphical analysis to provide information regarding the project’s performance. It could do this given alternative conditions concerning the project’s geometry, orientation, building systems and material properties.
Soviet Contributions
While all these developments were happening in the U.S., two prominent programmers from the Soviet Block would end up defining BIM as we know it today. Leonid Raiz and Gábor Bojár founded the two groundbreaking programs ArchiCAD and Revit.
ArchiCAD is notable for being the first BIM software available on personal computers. Revit, which was developed as an improvement on ArchiCAD, could handle more complicated architectural projects.
Revit
Revit revolutionized the world of BIM by using a visual programming environment to create parametric families and allow for a time attribute to be added to components. This allows a “fourth dimension” of time to be associated with your building model, enabling contractors to make building schedules based on these BIM models and simulating the construction process.
The Freedom Tower in Manhattan was one of the first projects to utilize Revit for design and construction schedules. It was built in a series of separate but connected BIM models that were tied to schedules, providing real-time material quantities and cost estimations.
What Is the Future of Modeling?
Although the concepts and technologies behind BIM are almost 30 years old, we have only begun to realize all the potential benefits of this growing industry. In the years and decades to come, possible advancements include the following concepts.
Project Quantum
The purpose of Project Quantum by Autodesk is to make BIM work in the cloud. As of now, applications are designed with one type of user in mind and have their own data formats. Autodesk wants to make some of its applications work together in a common data environment. This concept was demonstrated by opening up four applications on a single screen, with one of these platforms being Revit.
Each time a change was made using Revit, the change would appear in the other three applications. This data isn’t being translated to be compatible with other applications — it is instead transmitted to the other platforms via Quantum.
Live Sensors
With live BIM, we can make 3D models of buildings, bridges and roads using real-time sensors. We then combine the 3D model with environmental and physical data, resulting in the model changing color and shape based on these data. These live sensors can alert you of a problem before something actually goes wrong. By doing this, you can get a more comprehensive idea of how a structure behaves.
Work With a Data Modeling Expert
At Take-off Professionals, we create 3D data models for layout and machine control. We also offer earthwork takeoffs with material quantities and dirt, cut and fill maps and mass haul analysis for roads and sites. Our cutting-edge process allows you to easily access high-quality data, providing you with the confidence to complete a project successfully. You can reach out to us for more information on working with us for an upcoming project by calling 623-323-8441, or filling out our contact form.
The urgency to start projects and complete them quickly has become common. No matter what the use, the quicker the job is completed, the faster it’s used. Being first on the site, civil contractors generally have the least complete plans to start with. Owners do not understand that we need to know what the project is going to look like before we start planning. I have set some baselines for producing data for fast tracked projects that makes things easier for everyone.
There are three models that we will end up building which represent three distinct phases. Here are descriptions of the three basic model types for clarification.
Mass Excavation: This represents the bulk cuts and fills on the project. Expect no better than 1-foot accuracy.
Mass Grading: This brings things within a tenth. Retention and landscape areas should be good, and the building pads and parking areas may not be finalized.
Fine Grading: This is the final detailed information. Entries, parking, and building pads are all finalized as well as specifics for landscape, walks, and installations on site such as benches and playground equipment.
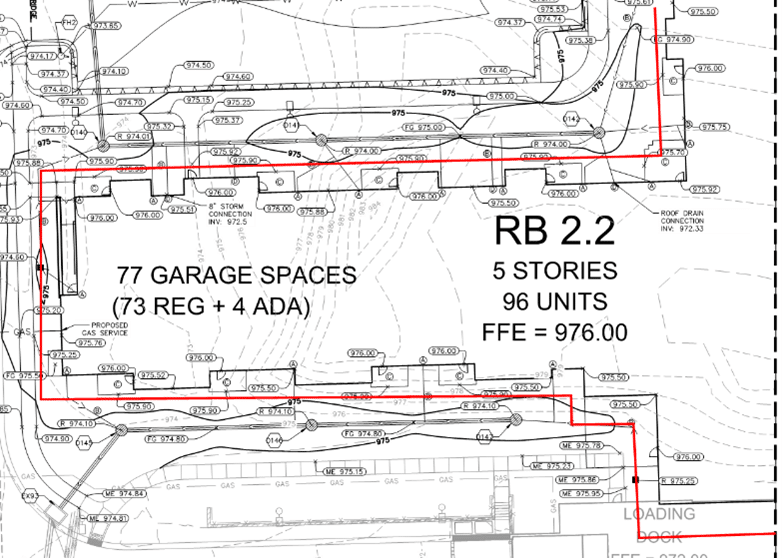
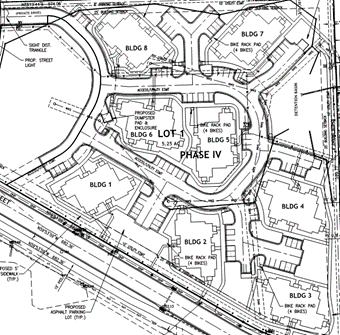
It seems no matter how much information we get, we always need more. I will go over the information we need and how to build each of the three models. Communication with all parties is critical. The example used is for an apartment complex. The owner is not sure how many units to build. Pre-leasing will help in that decision. In the meantime, pads, parking, and common areas are not finalized. We will work with engineers to make sure the contractor only moves dirt once and the project keeps running.
Mass Excavation
A “complete” set of plans needs to be submitted for approval. After permitting, things always seem to change. In this case, we will get enough information together to have scrapers and dozers working.
Before the crew gets to localize the site, equipment is moved in. We provided two different PDFs for use in the field. This may seem like something to keep the owner happy, but I want the work to count. The PDFs contain a 50-foot grid for cuts and fills. It’s enough for a couple days until the GPS can be set up on site and the real work begins.
As you can see in the image, we had finished contours for the retention to the east and rough grades for future pads. The bulk of the work is the buildings that are in the central area.
The plan set shows buildings and related access. With changes coming, we will smooth out the area and make some haul lanes. This is not a big site so we either need to start detailing or the contractor will have to leave, something that the owner does not want.
Even if the buildings change, we can get close to finish because there is usually not much elevation change between the pad and the paving areas. The biggest concern is not to build pads that are too big. This job required special compacted fill for the pads and the cost of an oversize pad would be substantial.
Summary
We can generally use the contours to get started. With larger cuts and fills, the time to get to the next phase is longer but the urgency is still there. Too much dirt moved or placed is not acceptable. Here are some tips:
Get a good OG topo. LIDAR or a drone topo is the way to go. Do not trust the contours from the plans if possible.
Be sure to get major drainage in at this point. No sense in making temporary ditches to move water.
If roads are being built, consider using that path for haul roads. Final grades can be cut on this well compacted surface easier than loose material.
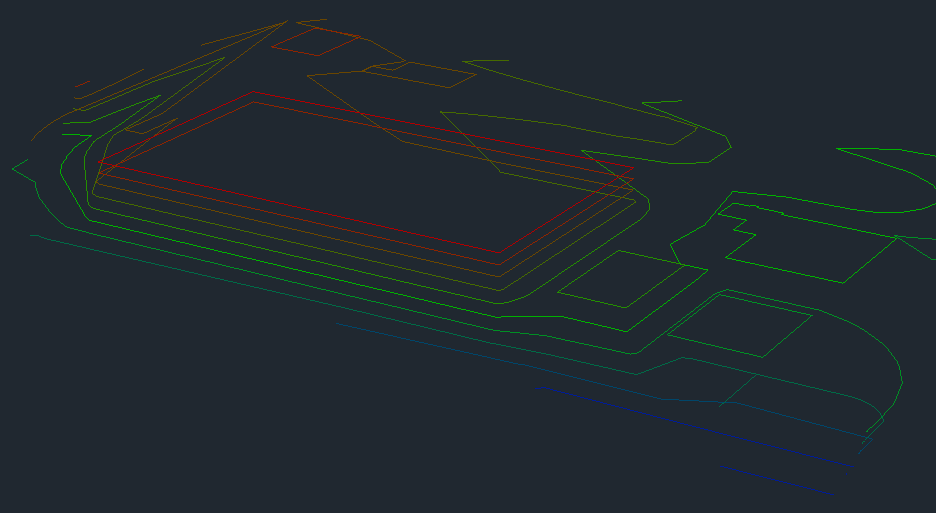
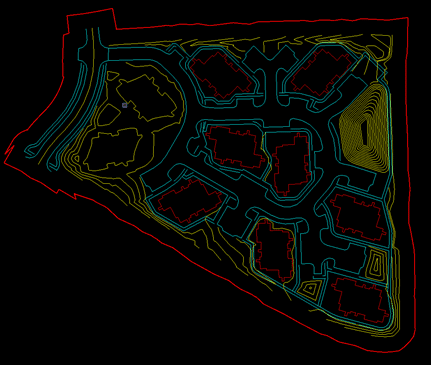
Mass Grading
When we build this model, we know general footprints and elevations. I want to get things as close as a tenth of a foot. To do that, a lot of things need to be in place.
Pad sizes and elevations.
Streets should be close to finish. If the pads are good, street elevations are usually related to their elevations.
Utility rims and grates are set to finished elevations.
Parking lots are not detailed but close enough to rough things in.
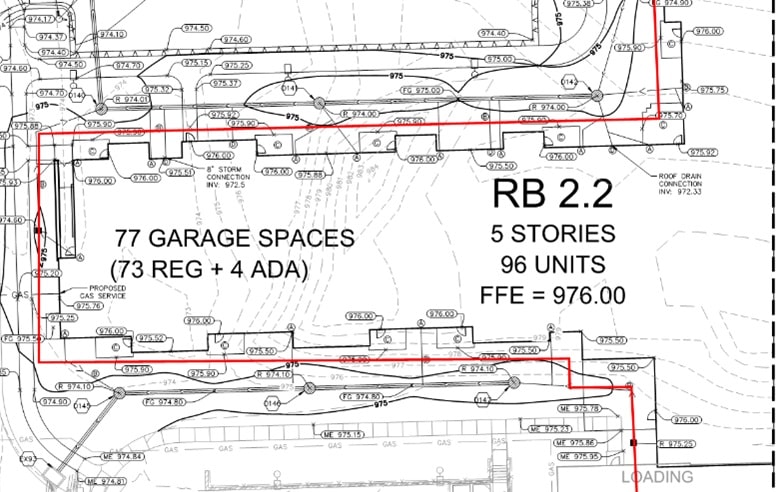
For this job, I set the building pads to elevation and size. They will be handled as their own sub-set due to select fill and compaction requirements. The curb is laid out and we have a good idea of the 2D location. Final elevations will be worked out in the last file.
As you see her, the design looks complete. It will allow the contractor to get the pads done and rough in the streets after the utilities are placed. I like to square up the pads, as that is the way they will be built. In this case they requested the actual layout.
When you are doing a job like this with a lot of detail in a small place, it is important to manage material. There is not a lot of room for excess dirt and we need to be careful with frequent drone topos to get rid of just enough material.
Summary
In a perfect world we could reduce files to no more than two. That is often the case if the rough grade file is ready to go and in a week we have the final information needed to make the fine grading surface. With the job described, the contractor needed plans to get them closer to finish without the final plans being ready. The rough grade file can buy the office some time to get the fine grading file ready. It’s important to walk away from a job and look at it with fresh eyes in the morning to get the last breaklines and spots for better performance.
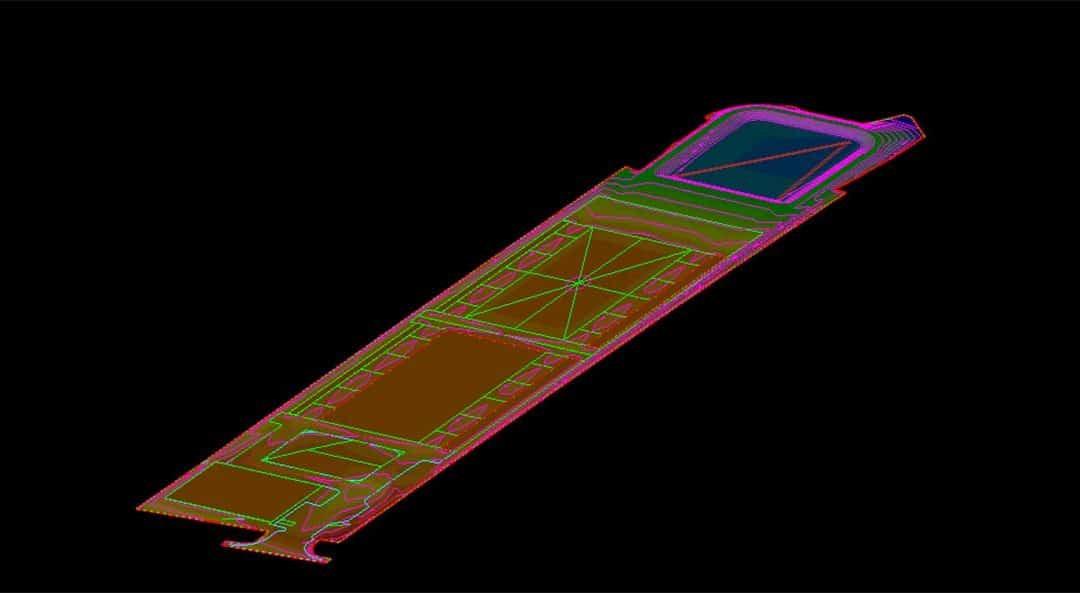
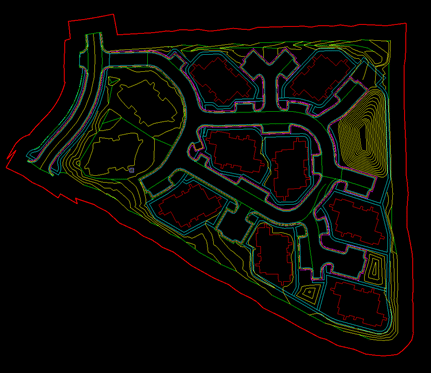
Fine Grading
With one more opportunity to get questions answered, we now create the fine grading surface. Here is what we are going to produce for this surface.
Retention areas to the correct volume required for the changes in the project along the way.
Correct slopes away from buildings for drainage.
Streets that drain to properly sized inlets.
Intersections that work with traffic and shed water. No humps in main streets that will not work with posted speeds and pullouts and deceleration lanes that drain.
Sidewalk ramps to ADA standard with sidewalk cross slopes at less than 2%.
Parking lots graded to move water and contain no abrupt slope changes to catch low front scoops.
As many breaklines and additional spot elevations required to make all the above work.
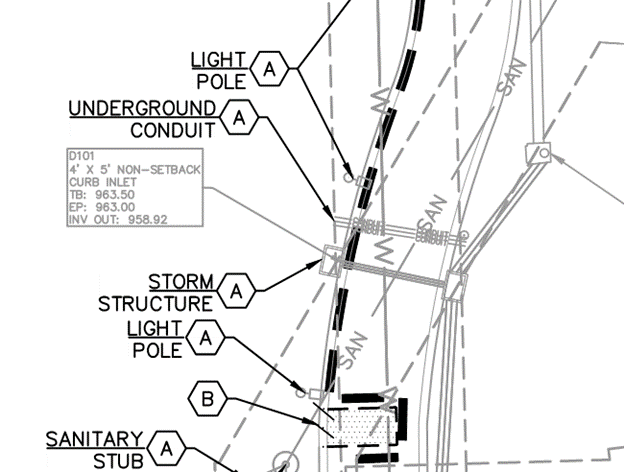
As you can see from the image, we added a lot of information to make the final file. These details will make the model perform better as well as give the contractor a look at what will be required to finish the project.
The green lines in this model are breaklines done by our engineer Michael Stallings, to help the surface do what we want. These are 3D lines that connect elevations on the surface to make sure the TIN links with correct elevation points. Of all the things in a model, the breaklines are the most confusing for new model builders. There is no easy answer. You need to draw a breakline in an area the does not look right to see if it improves the performance. If it does not, delete and try something else.
Summary
You want the fine grading file to be sent out last. We have had jobs where we sent out ten files as revisions and updates. The fine grading file should be a finalized surface of the information you have. If you do not have that, do not call it fine grading. The field needs to understand what the different file types do and know the tolerances placed on them.
Conclusion
Many times, we can get one file out the door with all the information needed built at once. We only hear from the contractor for the next job. I hope you have the same result and do not need to send multiple files. The following process will save you time and trouble.
Keep file names consistent. If you use “Mass Grading” use it every time. The field will know it is close but not final, they can work with that in mind.
Put dates on every file. It saves confusion.
No need to bring a lot of equipment to the site initially. Start with some non-GPS machines for initial work and bring in guided equipment as things get moving.
American suburbia is practically synonymous with cookie-cutter houses, carefully manicured lawns and winding roads. Another staple of these types of neighborhoods is the cul-de-sac. These road designs have been used in suburban planning for the better part of the last century, increasing in use alongside American car-ownership. While cul-de-sacs are necessary in residential planning, however, they pose significant challenges for those involved in the planning. In particular, designing a 3d model cul-de-sac can be difficult due to the unique geometry involved. For this reason, we’ll cover the basics of cul-de-sacs in city planning, how to draw a cul-de-sac in AutoCAD and how Take-Off Professionals can help simplify the process.
What Is a Cul-De-Sac?
The cul-de-sac has been a common feature of the American suburb since the mid-20th century. This French term translates to “bottom of the sack,” and is used to refer to a dead-end street where the only outlet is the entrance. These suburban road designs are a direct result of the American motor age, purposefully created to allow for more spacious property facades while simultaneously encouraging slower car movements.
Cul-de-sacs were first used in 1928 in New Jersey, but gained popularity in the 1950s as car ownership boomed. The design gained further popularity as engineering studies on residential street safety encouraged more discontinuous street systems like cul-de-sacs. These studies found that such designs reduced the number of motor vehicle accidents compared to grid-based designs, and generally encouraged safer driving practices. Both features proved to be highly desirable for the more family-centered residential neighborhoods.
How Are Cul-De-Sacs Designed?
While it is simple to describe a cul-de-sac as a dead-end street, there is much more that goes into the design. Cul-de-sacs vary in road length but are typically designed with wider-than-normal road widths to allow cars to park along the sides while still allowing residents to enter and exit. These roads may be even wider if driveways are placed along the roadway. The defining feature of the cul-de-sac, however, is the wide, circular termination. This termination is where most of the residential driveways are placed. Cul-de-sac terminations are typically 100 feet or more in diameter, which allows cars to easily maneuver in and out of driveways and service and emergency vehicles to turn around.
Cul-De-Sacs in Neighborhood Planning
Homebuyers desire cul-de-sac-based communities for their safer streets, neighborly environments and lower crime rates since criminals tend to avoid confusing street patterns that make for more difficult getaways. While these features make cul-de-sacs more desirable for residents, planners favor them as well. Here are a few reasons why:
Reduced infrastructure costs: Cul-de-sac patterns require significantly less road and utility construction compared to grid patterns. Grid patterns require up to 50% more road construction and 25% more water and sewer line construction.
Improved topographical adaptation: While grid patterns blanket entire regions with invasive infrastructure, discontinuous cul-de-sac patterns can be designed to work around areas that may be more topographically challenging or ecologically important.
Decreased standards: Because they do not carry through-traffic, city regulations often do not apply in the same way to cul-de-sac-based neighborhoods as they do to grid patterns. As such, planners have less to worry about with regards to street widths, curbs and sidewalks.
These planning advantages make cul-de-sacs beneficial for home-buyers and a useful tool for neighborhood planners as well. For this reason, knowing how to design a cul-de-sac in 3D is a necessity for any construction design professional.
How Are Cul-De-Sacs Modeled?
Cul-de-sacs can be modeled with any AutoCAD software just like any other type of road. Using the data collected from a detailed topographical survey, planners can create a general plan for the roadways and cul-de-sacs. From there, professionals can then combine these plans into a detailed 3d model using AutoCAD software. Models should feature the cul-de-sac road, as well as any lots surrounding the cul-de-sac.
Cul-de-sacs can be modeled in several ways, but four primary features determine the overall shape and size of the cul-de-sac:
Centerline curve: The centerline of a cul-de-sac is the centerline of the street leading to the termination. This centerline can be curved or straight, dictating the overall shape of the cul-de-sac road. The centerline curve is typically determined by the topography of the area and should be placed in a way that allows plenty of room between the road and any topographical features that will not be altered during construction.
Terminal radius: The radius of the circular terminal is the distance from the center of the terminal to each side, and determines the overall size of the cul-de-sac’s terminal. For cul-de-sacs, this radius is a minimum of 50 feet, which results in a terminal that is 100 feet wide to allow plenty of room for emergency vehicles. The radius may be wider, especially if the cul-de-sac features a center island.
Termination placement: The termination of the cul-de-sac is designed to be a circular shape, but this circular feature may be placed in various ways. A symmetrical cul-de-sac is designed with the circular feature placed straight on the end of the centerline, resulting in the traditional match-head shape of a cul-de-sac. Alternatively, a cul-de-sac can be designed with the circular feature offset up to 90 degrees from the end of the centerline, resulting in a terminal that curves to one side.
Return curves: Placing a circular shape on the end of a rectangular road will result in sharp edges at the meeting points between the two shapes, which is undesirable for road construction. For this reason, the transition from the circular cul-de-sac terminal to the road is graded using return curves.
The above features are essential to know and consider while modeling for cul-de-sac neighborhoods and will come into play during the design process discussed below.
How to Design a Cul-De-Sac
Designing a 3D model cul-de-sac in AutoCAD is the most important step before initiating construction, as it creates a detailed plan to work from that can help streamline construction and minimize costly mistakes. However, cul-de-sacs are more difficult to design than normal roadways. One of the easiest ways to accomplish this model is by starting with a square and rounding off the corners to create a circle. This is a step-by-step guide for how to create a cul-de-sac with a rounded terminal using this method:
Draw the road: First, create the road section of the cul-de-sac. In AutoCAD, this will appear as parallel lines with no clear termination. Be sure to place the road in a way that goes around topographical features that will remain in the final construction.
Terminate the road: Draw a straight centerline across the end of the road where the circular terminal will be placed. Keep in mind that the terminal will extend past this endpoint by the termination radius, so allow enough room for the radius extending past this point. Make sure that the length of this centerline matches the diameter of the cul-de-sac, and place it according to the type of cul-de-sac you want to make. If creating a symmetrical cul-de-sac, place the middle of this centerline at the end of the road’s centerline. If creating an asymmetrical cul-de-sac, offset the new centerline as desired.
Create the terminal base: Using the centerline drawn in the previous step, create a square section of road with a width that matches the diameter of the desired terminal. This should result in a square section of road that approximates the shape and size of the final terminal. At this point, double-check the placement of the road square to make sure that the terminal placement is correct. Symmetrical cul-de-sacs should be placed so that all sides of the terminal are equidistant from the centerline endpoint for the main road, while asymmetrical cul-de-sacs should be offset to one side.
Create the junction: At this point, the AutoCAD software will detect a junction and should prompt you to create the return curves for the terminal. Enter the desired radius for these return curves — these should be fairly small, but keep in mind that the smaller the radius, the sharper the curve.
Round out the terminal: At this point, you are ready to change the shape of the terminal to a circle. Use the road tools and select the section of road you have created. Depending on the software you are using, you should have the option to either change the shape all at once or to select each corner and set a radius for a curve. Make the changes according to what your software allows.
Adjust terminal placement and junctions: From here, you can change the details of the terminal to match your desired plan. This may include moving the terminal from a symmetrical to an asymmetrical placement or vice versa. You can also change the radii of the junctions to create more gradual return curves.
Add grading: Once the overall shape of the cul-de-sac is complete, you can combine this design with a topographical map or manually change the vertical leveling of the model to match the topography of the construction project.
The above guide represents a basic method for modeling cul-de-sacs in AutoCAD that practically any construction planning professional can use, with some adjustments depending on the specific software. But we have yet to address an important question about modeling for cul-de-sacs — why is it so important to model cul-de-sacs accurately?
Why Model Cul-De-Sacs?
Construction sites used to rely solely on surveyor stakes, heavy-duty equipment and quality operators, but 3D modeling has brought about significant changes in the way residential areas are constructed. 3D models for construction projects create more accurate layouts that precisely show what is needed and can identify potential problems before equipment breaks ground. This careful planning minimizes project costs significantly by reducing errors and maximizing labor efficiency. This is especially important for residential cul-de-sac construction, which is highly affected by construction costs and is significantly inconvenienced by lengthy construction periods.
On top of the cost benefits of implementing 3D models in traditional construction, 3D modeling can be used in implementing 3D model machine control. If you’re not familiar with this concept, machine control uses positioning sensors on equipment to give machine operators real-time feedback during construction. These sensors tell operators how to position buckets and blades as well as target grades, which minimizes error and maximizes construction site efficiencies. When implemented correctly with quality 3D modeling, machine control can help achieve the following:
Increased machine efficiency: By providing detailed feedback and instructions, machine control helps operators maximize machine efficiency and productivity.
Decreased operating expenses: Because the equipment is used more efficiently, construction projects require less fuel and maintenance to achieve the same results.
Minimized materials costs: 3D modeling allows for improved visualization of material usage, meaning that raw materials are used more effectively.
Reduced surveying costs: Using 3D models and sensors, the equipment provides feedback about grades to operators, reducing the need for ongoing grade checking.
Lowered labor costs: With more effective sensors, workers get real-time feedback that makes them more efficient, reducing the amount of labor needed for each project.
Minimized errors: Real-time feedback allows workers to see their progress as they go and catches errors early, reducing the need for reworking areas.
The key to achieving these benefits for cul-de-sac projects, however, is using complete and accurate 3D models. This is why construction companies are increasingly choosing 3D machine control modeling services to help with their neighborhood construction projects. If you’re looking for quality modeling for cul-de-sac projects, Take-Off Professionals can help.
At TOPS, our specialty is preparing 3D data models for construction sites of all types. With over two decades of experience providing 3D models for the construction industry and a talented team of engineers and technical staff, we have what it takes to transform your data into what you need to achieve your goals. We produce approximately 1,000 machine control models a year, and our clients can attest to our accurate, timely and detail-focused service. Best of all, TOPS has engineers working in all major U.S. time zones, providing timely service across the nation.
In addition to our high-quality service and staff, TOPS provides a unique platform for our clients to upload all their project files, notes and related documents. With this secure and user-friendly program, our clients can communicate with us effectively while still being able to focus on their core business. It’s all part of our dedication to a hassle-free client experience.
Contact TOPS today to learn more about the benefits of our services and how we can help with your next residential construction project.
Mass haul refers to a calculation that multiples the volume of material with the distance that it’s transported during construction. It’s commonly used in construction and civil engineering projects as they often involve excavating and moving large amounts of earth. A mass haul movement is the transportation of this material from its original location to where it’s going to be disposed of, treated or used.
Deciphering Mass Haul Diagrams
A mass haul diagram provides viewers with a graphical representation of the material moved. In particular, the diagram will showcase the amount of material that’s been transported along the centerline. It also displays the distance that the materials travel while being transported. In this diagram, you can often see grade points, overhaul and free haul regions and balance points.
Some of the key terms you should know to read a mass haul diagram properly include:
Haul: A haul refers to the transportation of your project’s excavated materials. The haul includes the movement of material from the position where you excavated it to the disposal area or a specified location. A haul is also sometimes referred to as an authorized haul.
Overhaul: When you get authorization to haul material farther than the original free-haul distance, the transportation of said material is called an overhaul.
Free haul: A free project’s average haul is referred to as a free haul.
Average haul: You can find the average haul using the mass diagram. The average haul is a specific area in a mass diagram. It represents how many cubic yard stations are between balance points divided by the ordinate of mass that the yardage gets hauled.
These diagrams are crafted using a mass haul view and a mass haul line. The mass haul view refers to the grid where the mass haul line is placed. The mass haul line refers to the overhaul and free haul volumes in fill and cut conditions that run along an alignment.
A project is in a cut region if the mass haul line rises. In contrast, if the mass haul line drops, the project is in a fill region. The diagram’s grade points and balance points will mark mass haul regions. Essentially, the mass haul line’s position in relation to the balance line shows viewers the movement of material.
On these mass haul diagrams, you can compare overhaul volume and free haul volume with the project’s grade points and the balance points.
Achieve Exceptional Mass Haul Analyses With Us
Looking for unparalleled assistance with mass haul diagrams? TOPS’ experts deliver insightful Earthwork Takeoffs featuring cut/fill maps and mass haul analysis. Prevent mistakes, avail consistent services, harness cutting-edge technology and tap into expert staff with TOPS!
Grade points are stations on a mass haul diagram that shows when a project design shifts from cut to fill. A grade point will reveal the lowest or highest point in a region of a mass haul. When the grade point in a mass haul region is the highest point, it represents where the project’s profile switched from a cut condition to a fill condition. The opposite occurs when the grade point is at the lowest point of a mass haul region. At this lowest point, the profile goes from a fill condition to a cut condition.
To measure free haul using grade points, you draw a horizontal line that is long enough to cover the span of the particular free haul distance. The line is placed so it contacts the mass haul line and runs parallel to the diagram’s balance line. The free haul is the volume of the area that’s inside the mass haul line and the horizontal line.
Identifying Balance Points in Mass Haul Diagrams
On a mass haul diagram, balance points refer to the stations where the fill volumes and the net cut are equal. These balance points can be found on the diagram’s balance line. More specifically, the balance points are stations where the net volume equals zero on the line.
To measure free haul with balance points, begin by duplicating the mass haul line and move horizontally. The distance it moves will be based on the free haul distance. If the project goes from cut to fill, you’ll shift the balance point to the right. You’ll move the balance point to the left when the project goes from fill to cut.
The Practical Applications of Mass Haul Diagrams
Mass haul diagrams are primarily used to provide a more accurate representation of the materials being moved. They give viewers key information about free haul, average haul and overhaul. For instance, you can calculate the free haul between specified balance points. Besides just finding the free haul between two points, you can find the free haul of the whole project.
They also have the very practical use of telling professionals and contractors the way project material needs to be transported. The diagram can showcase how much dirt a project needs to move. If you’re doing a significant amount of excavation or filling, the information that mass haul diagrams can provide is invaluable.
Additionally, you can use these diagrams to compare different proposals. Since contractors and designers can better understand where gross material movements will occur, these diagrams are perfect for showcasing how different designs approach the project. An accurate representation of the material needing to be excavated and hauled can help a company create an accurate quote for a potential client.
Optimizing Road Construction with Mass Haul Diagram Calculations
One of the major ways that mass haul diagrams are used is to assist with roadway design. Mass haul diagram calculations and drawings are crucial to helping designers find out how much earthwork is needed for a project. The earthwork that gets calculated takes into account the needed fill material to construct a roadway’s embankment and the existing earth material.
The ordinates on the mass haul diagram will be the sum volume of embankment and excavation. As such, road designers will hope that the initial ordinate is equal to the final ordinate to ensure the volumes of the embankment and excavation match. Designers use the diagram to make sure the total volumes of the embankment and excavation match.
If a designer notices that the initial ordinate is less than the final ordinate, the project has too much excavation. For projects where the initial ordinate is greater than the final ordinate, the embankment’s volume will be higher than the volume of materials you have to complete the embankment. This discovery will signal to a construction professional that they need more materials to complete the project.
During a highway construction project, these calculations are especially helpful. Construction professionals can use the calculations to balance the total amount of fill and cut of the highway project. By balancing them, contractors prevent having to spend extra money hauling more materials.
Delving into Mass Haul Analysis: Understanding the Basics
A mass haul analysis is a feature often included in mass haul software. This type of analysis allows users to determine the haul distance and volume of a project’s net fill station ranges and net cut groups. To minimize the total volume-distance transported, a mass haul analysis program can calculate the best cut to fill movements.
Crafting a Mass Haul Diagram: A Step-by-Step Guide
Making a mass haul diagram starts with gathering a list of materials. Next, you need to have a simple line group and an alignment. On the x-axis, you’ll graph sample lines, which are sometimes referred to as stations. On the y-axis, you’ll graph your cumulative material volume. This cumulative material is usually earthworks. The balance line takes the form of a middle axis line, standing for zero cumulative volume.
There are a few different mass haul diagram software programs on the market that can help you generate a diagram. They each have their own processes for creating mass haul diagrams. These programs should allow you to do a mass haul analysis to see if you’re moving the needed amount of material, among other factors. For example, Autodesk’s mass haul diagram program, Civil 3D, is popular in the industry.
Financial Advantages of Utilizing Mass Haul Diagrams in Projects
Haul plays a significant role in determining the cost of conducting any earthwork for a project. A contractor or construction professional will need to create a bid price based on their estimation of their rate of haul, the equipment they need to transport a haul and the total amount of material that’s going to be hauled. By knowing information about the equipment you need and the rate of haul you can provide, you’ll ensure you cover your costs and make a profit.
One of the most important stats you’ll need to understand before you estimate your haul costs is the rate of haul. To get this information and the total haul, you should know where the project’s gross material movements happen at the worksite. As you attempt to determine this information, you can use a mass haul diagram.
An accurate and detailed mass haul diagram will give a company the information it needs to estimate the project’s total haul. For one, the mass haul diagram will indicate whether there’s a deficit or excess of material at various points in a project. The diagram also should give you a visual representation of the project’s cut and fill material. Detailed diagrams will also use curved lines to show how the material is moved during the project’s lifecycle.
With all of this information from a mass haul diagram, a contractor can figure out the most cost-effective way to complete a project. Since you won’t include the amount of material taken from borrow sources in the mass haul diagram, you can get an accurate take on your on-site materials and figure out the most cost-effective way of completing a project. In this evaluation, you can decide on haul, grading limitations, borrow source location, existing material placement and scheduling concerns.
The Strategic Value of Data Modeling Experts in Mass Haul Planning
Mass haul diagrams are crucial for any time you need to transport materials on a job site. Working with Take-Off Professionals (TOPS) means you have Data Modeling Experts in your corner to assist with mass haul diagrams and analysis. We’re proud to provide our clients with Earthwork Takeoffs that feature cut/fill maps, dirt and material quantities and mass haul analysis for roads and sites. Along with offering these services, we also can create haul roads for your project’s entire life cycle.
There are many benefits to working with the data modeling experts at TOPS. Some of these advantages include:
Prevent mistakes: With our team in your corner, you get peace of mind. We’ll comb through your mass haul diagrams and ensure that there aren’t any problems. It can be a real headache if you realize you haven’t accounted for enough material once a project is already underway. Trust us to examine the details of your data to prevent mistakes from impacting your project.
Consistent service: You want someone you can trust in your corner. Your company may have a consistent style for diagrams, or you may need services completed quickly to keep up with your project’s demands. We’ll build your data in the exact way you require it, making it easy to read and in a form you understand. Additionally, you can trust us to keep up with your pace.
Cutting-edge technology: Staying up to date on the latest technology is absolutely vital in our industry. We’re always up to speed on the latest software and are continually improving our services. To prepare for every job, we consistently use four different kinds of software. We also have a broad range of experience with different programs, meaning we can use the best package to deliver exceptional results.
Expert staff: Our staff is filled with a variety of experts, from operators and grade setters to surveyors and engineers. They all have experience in their respective industries and can lend their expertise to different aspects of the project.
Focus: Our company focuses on data. We’re not here to sell you supplies, software or equipment. Instead, our only goal is to optimize your data and perform industry-leading takeoffs. This level of focus means we can devote all of our efforts to taking your data analysis to the next level, especially when it comes to evaluating a mass haul diagram.
Enhance Your Project with Take-Off Professionals’ Expertise in Mass Haul Diagrams
Check out our many services to find one that works for you. If you’re interested in a mass haul diagram analysis, contact us today to discuss your options.