The Bell Helmet Company once had a magazine ad with the statement, “If you have a 5-dollar head, get a 5-dollar helmet.” Wise words when you think about protecting your brain. The interwebs have done a great service to us; we now have experts in every corner of the world. I admire some of them but do an eye roll with many. As one of the original innovators in the industry, I’m not pulling rank, I am speaking from experience. I just do not like to hear bad information being passed off as truth.
Regarding those who advertise low-cost data, I have but one thought: If your work was worth more, you would charge more. So many people are not invested in making a good product, but just making a product. I have spent my career working on delivering data in the fewest mouse clicks possible. We like to bill for work done efficiently by trained professionals who have been trained by experienced mentors familiar with a lot of different data issues. When the experience issue gets brushed aside as a “nothing burger” by more recent entrants to the data industry, one has to look at the actual time it takes to decode and properly set up a project.
Many times when inexpensive data gets built, it is just converting a surface built by the engineer at some point in the design. This is usually done to get a rough dirt number so that some quantities can be put on the plans. When doing a takeoff and I was close to the engineer’s numbers, I went through things again. Those quantities are usually never close. The surface is not only a few changes behind the plans, it lacks the detail for successful grading. Here is why proper data takes a bit of time.
Initial Data Files
We receive the plans and CAD in addition to a work order for the job. We often find that the plans and CAD are a mismatch. Not a big deal. Just find out which of the two is correct, get the current file and we are good to go. For every job we do, the files get touched by no fewer than three software platforms. It is not cheap to have all that horsepower, but we can do a more efficient, competitively priced job with them. We need to read the plans and relevant specifications to insulate our client from issues. We want no surprises. Notes on the job guide our work, then we start building.
The Big Picture
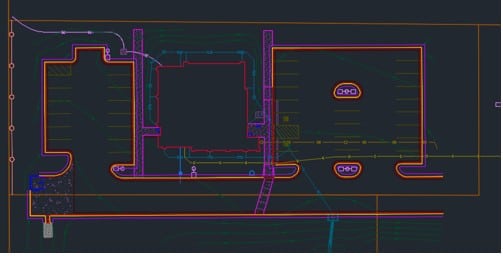
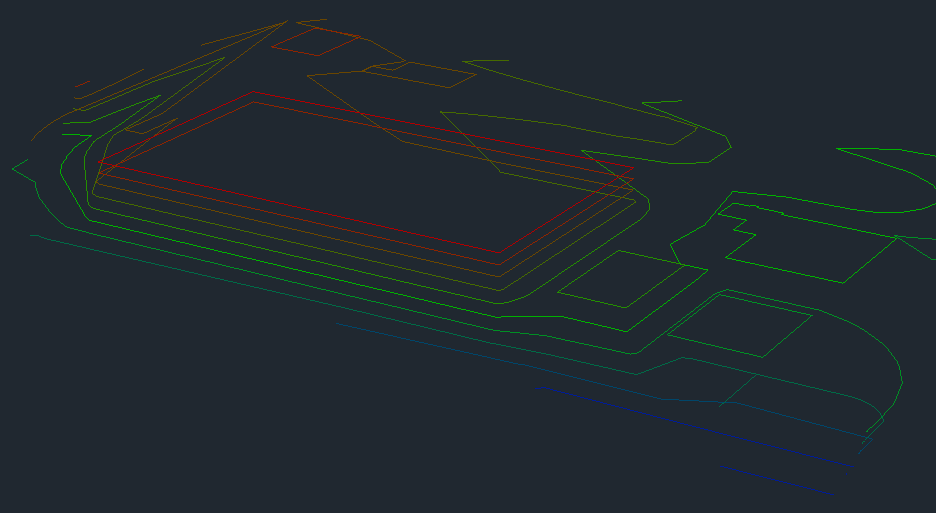
I will use a sample project to give you an idea of what good data, coupled with 25 years of experience, looks like. The data engineer working on the job has a deep bench of talent to call on for advice. A great advantage that goes a long way in securing a good job for our clients. Here are the basics:;
The entire job consists of a building with a basement, parking for 200 vehicles, and a long entrance road.
There is detailed landscaping along with a lot of drainage work, (wet part of the country).
We also need to build an initial water management surface, as all the water needs to stay on the project. Watershed pollution prevention.
Initial CAD Work
We have detail sheets that we populate for our clients. Surface density, line colors, file types, and delivery method are a few of the things that make a job easier for our clients’ field crews. As a former field hand, I like to be in their corner and do everything possible for them. Five minutes of work in our office on the computer saves 30 minutes balled up in the cab of a work truck, trying to change something. Here is the process.
Civil 3D files can be feature rich. That is good news for somebody doing poor work and just converting a surface. In our world, that is something we delete to make the file smaller.
Lines have become critical. A grade checker will want a 3- foot back of curb 3D line to set string or hanging forms. A blade hand wants to snap on an edge of pavement line to shift the blade 2 feet behind the curb for slip former access. All of these lines need to be in the correct direction, void of any overlaps and breaks. That takes time.
With the paper plans ruling, we need to confirm that the job looks like the CAD; this can be time- consuming and frustrating. The best that one can hope for is a spot check with budget data work.
In the early days, we worried about file sizes, but not so much anymore. It still makes sense to show only the lines necessary to complete the work. Text needs to be simple and in a format that does not steal bandwidth from a controller.
Surface Components
Since the beginning of the data business, we have used the same elements for building data. Each of these must be carefully created and work with the other parts.
2D Lines
Contour lines are really 3D lines as they are elevated. But because it is all the same elevation, we call them 2D lines. How those lines are produced is something the model builder will find out if they are doing their job.
Sometimes points are placed on the surface and contours are produced later.
Contours can be drawn by hand to show intent. That means you cannot use them on the surface, but they are nice to look at.
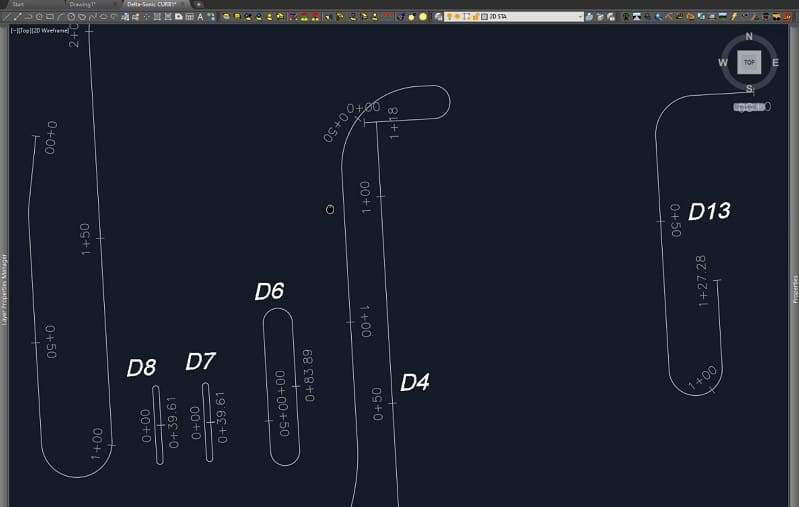
Contours are made first to show slopes and sheeting water, usually in a parking lot. They are interrupted later for islands and other features.
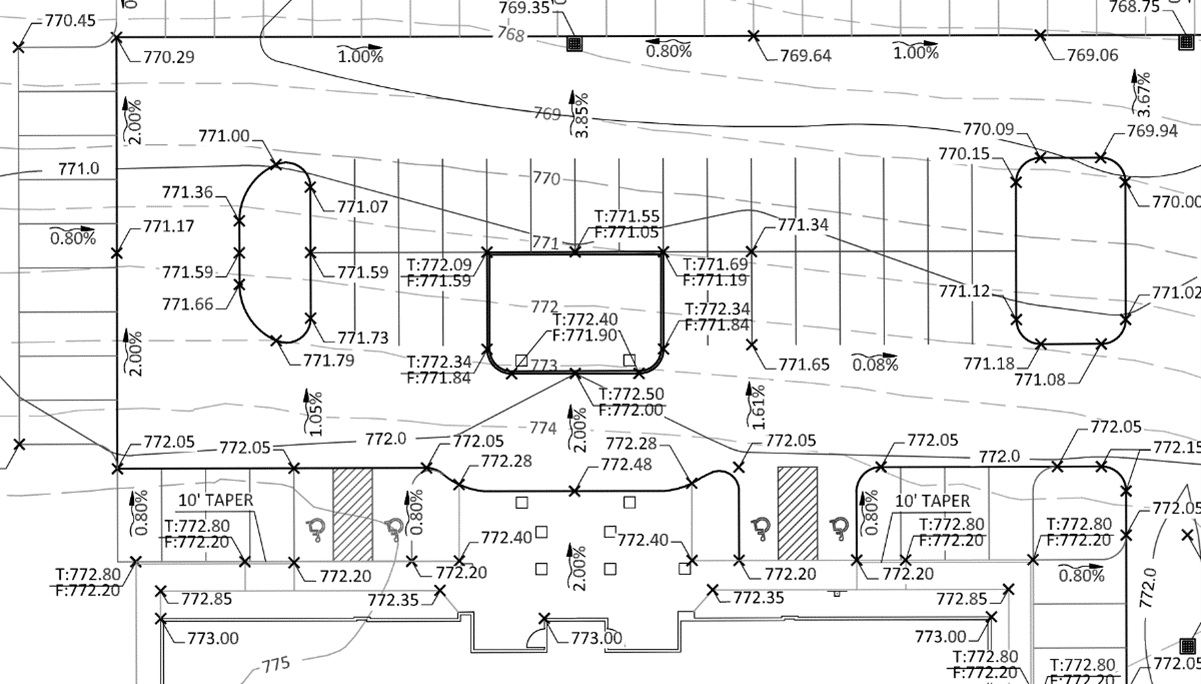
In our example shown above, the contours were drawn in later to show the general slope of the parking lot. The slope arrows provide some faint clues on how the water is moving. This one took some time to get right.
3D Lines
When doing curb, the elevation of a line changes. We first need to plug in the numbers from the plans, then fix issues that are obvious.
If there are things that do not make sense, we need to run a request up the ladder and get more information.
In our sample project, the slopes in the ADA parking areas are out of spec. This is not an issue; we check the percentages and make them right. If they do not fit, we need to talk to someone. A quick once- over of an engineer’s surface will not catch these small details.
There are a lot of things we can do with these lines. Offset the flow line to get top back of curb, even extend that line for staking. This requires us to create lines, which cannot be done from a surface found in the original CAD.
Points and breaklines
I have always used points to create an absolute elevation. Think of the rim of a storm grate.
Points are used by our clients to layout improvements.
Points are useful for curb radius points as well as footings and building corners.
We will do layout of light poles, playground equipment, electrical lines, and SES pads. The list is long.
Breaklines are used to make a surface respond the way you want it to. Triangle linking is indiscriminate and these lines make features look like the design. This could be from a simple ditch to parking lot flow lines.
They become the final tool to get things looking right. They are a necessary and sometimes frustrating tool. Too many breaklines and the surface is strained, too few and details get lost.
Summary
In order to use a surface made by someone else, the above issues would need to be addressed. It takes longer to take things apart and put them back instead of doing it right the first time. Cheap data uses information that is not correct. A few checks and it lands on your site. Instead of a surface you have a minefield, not knowing where the bad spots are. There is still a culture of “fix it in the field.”. This does happen when provided with too little information, but it is the rule when dealing with marginal work from less -experienced model builders.
I, in no way, am faulting engineers for this. Any surface made by them is for a different purpose. It is the job of the model builder to get inside the plans and understand the site from a singular point of view. Will it perform as intended? Years ago, I wrote an article in Machine Control Online Magazine. The title was “You Pay Us to be Nervous.” You just cannot do a good job in a couple hours.
3D technology is a relatively new emerging tool with the potential to impact the roadwork construction industry significantly. Integrating 3D-engineered modeling into highway building and repair projects can help make them more efficient, benefiting construction workers and the general public alike.
Here we discuss what 3D technology is, how you can use it in roadwork projects and how it can ultimately benefit the industry as a whole.
How Is 3D Technology Used in Road Construction?
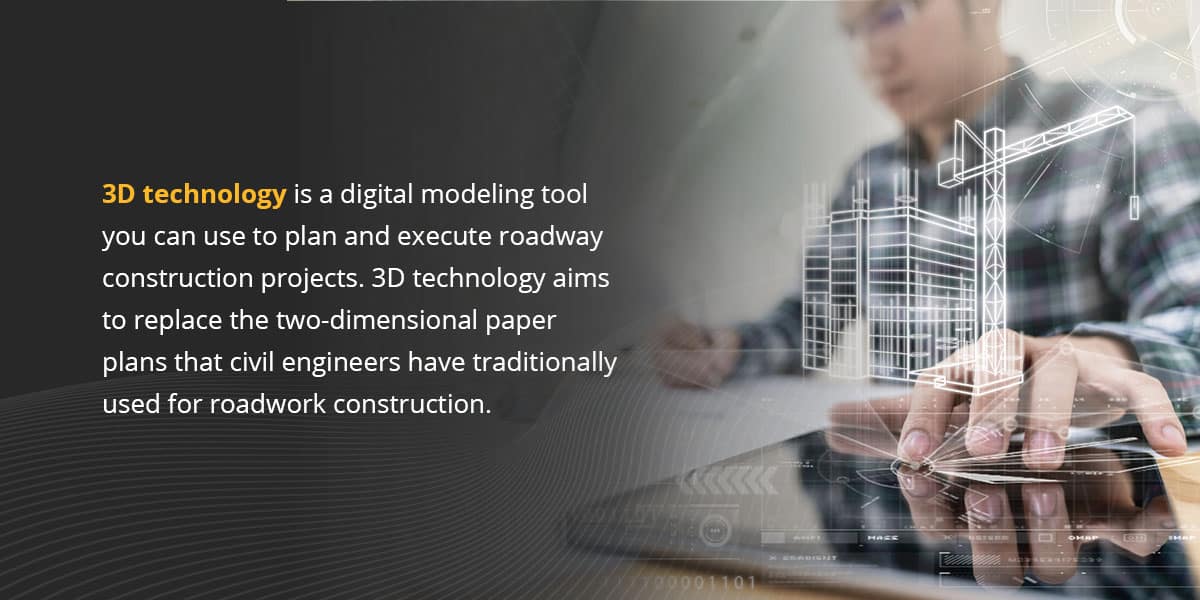
3D technology is a digital modeling tool construction teams can use to plan and execute roadway construction projects. Replacing traditional two-dimensional paper plans, 3D technology is a quicker, more cost-effective way to construct, maintain, survey and repair highways.
3D technology-rendered models are the result of comprehensive appraisal, design and coordination efforts. They produce a computerized depiction that accurately shows the existing site conditions and the designer’s intent. Contractors can use these 3D-engineered models to deliver a road construction project faster and with better accuracy than traditional 2D tools allow.
The process of creating a 3D model in construction begins with an aerial scan of the project site. Engineers use pilotless aircraft, such as drones, to survey the site. The aircraft transmits the data it collects to a scanning station, where designers use it to render a 3D representation of the construction site.
A complete 3D-engineered model includes the initial survey data along with suggested vertical and horizontal alignments, features and structures for the future site.
How 3D Technology Applies to Highway Construction
Whether contractors are building new roads or updating existing ones, 3D technology can help make the process safer, more precise and more efficient. Contractors can use 3D technology for automated machine control, project management and quality assurance.
For instance, 3D laser scanning allows construction workers to scan and record critical information about the road, using this data to develop an accurate plan. They can also prioritize problem areas to avoid potential issues during construction, thus speeding up overall project completion times and reducing traffic.
Additionally, 3D technology makes it easier to move and measure asphalt. Construction workers traditionally used milling machines for concrete removal. A 3D scanner helps them digitally detect the amount of asphalt they need to remove. Then, they can measure the precise amount of concrete they must pour to repair the road. Again, this can speed up the project completion time.
Read on to learn more about each of these innovative applications.
Automated Machine Control
GPS machine control negates the need for extensive staking and produces more accurate results. You can use it with the following roadwork construction equipment:
Grading equipment: Machine-controlled grading equipment, such as dozers, motor graders and scrapers, provide data on the cutting edge’s position relative to the design surface, with no grade stakes needed.
Excavators: Excavators outfitted with GPS or laser-controlled sensors can accurately measure slope, reach and elevation. The operator can visualize the elevation of the design and the tip of the excavator bucket.
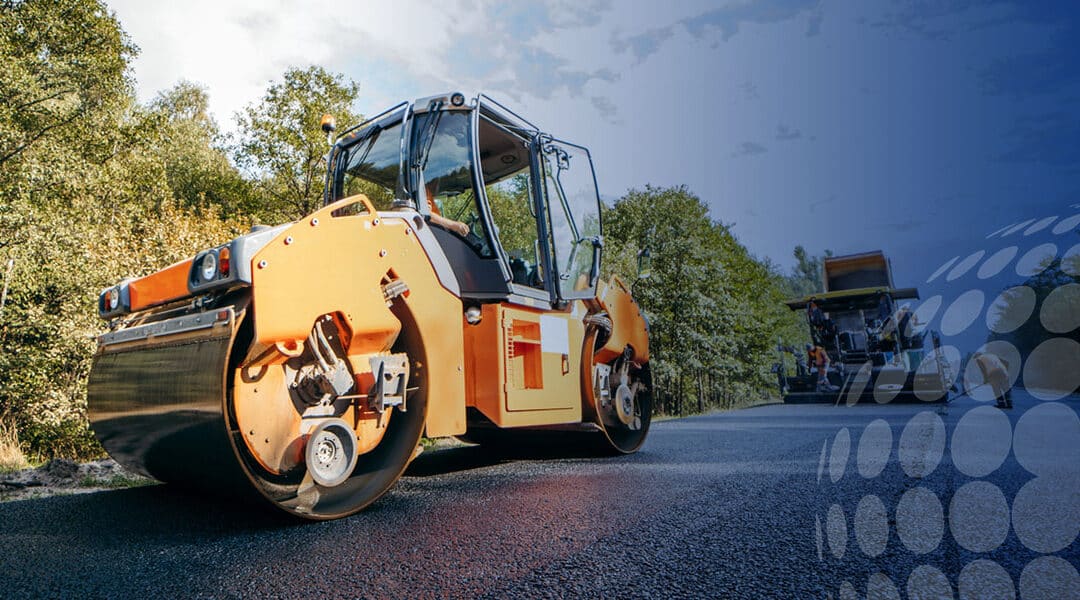
Compaction equipment: 3D technology-equipped compaction machinery like rollers lets the operator see live data on surface compaction directly beneath the roller as it moves. This intelligent compaction allows the roller to meet density requirements with fewer passes, cutting fuel and labor expenses.
Milling and paving equipment: 3D technology controls the vertical alignment of a milling machine’s rotors. 3D milling equipment can use information from a data station to modify slope and elevation, eliminating extraneous work from placing and readjusting stakes.
Scheduling, Cost Estimating and Project Management
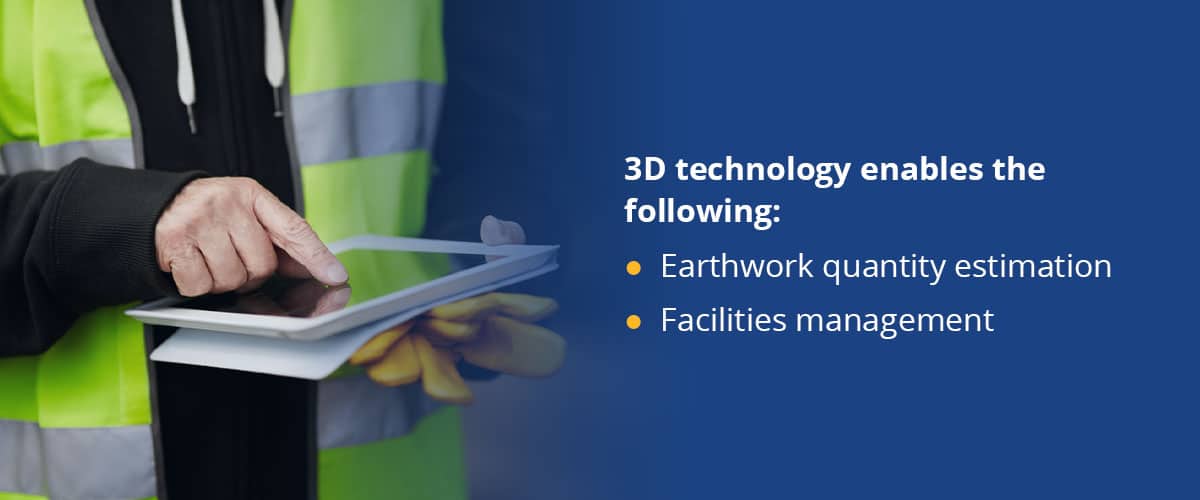
3D-engineered models can help civil contractors with cost estimating, scheduling and project management. In addition to streamlining the project for the contractor, these applications provide more value to the project owner. 3D technology enables the following:
Earthwork quantity estimation: While earthwork quantity estimations are a crucial part of any project, they require significant amounts of time. It’s also often challenging to produce them with the high level of accuracy they require. 3D technology can render highly accurate quantity estimations in short periods. The computer effectively determines the cut-and-fill amount at small intervals throughout the model limits. The digital terrain model can also efficiently balance earthwork and propose haul routes.
Facilities management: Civil integrated management involves the procurement, organization and accessibility of a highway facility’s precise information and data. This data includes planning, surveying, design, construction, maintenance, asset management and risk assessment. Civil integrated management syncs the designer’s 3D-engineered model with cost and schedule information to create a model that all project stakeholders can view.
Quality Assurance and Post-Construction
In addition to efficient scheduling and cost savings, 3D technology can also improve the quality assurance process during roadwork construction. With traditional 2D construction methods, inspectors must rely on grade stakes and 2D paper plans to ensure that grading operations follow the design. With 3D technology, inspectors can use handheld GPS devices to spot-check horizontal offsets and elevations.
The 3D-engineered model’s proposed grading surface lets inspectors perform random spot checks with GPS rovers to ensure the ground is graded correctly. The handheld GPS equipment compares the currently graded elevations to the proposed design surface at all locations within the 3D-engineered model’s limits.
Inspectors can also spot-check elevations behind the paver to confirm the paving machinery is set up and operating correctly. Contractors can rectify any discrepancies quickly, reducing the amount of rework needed.
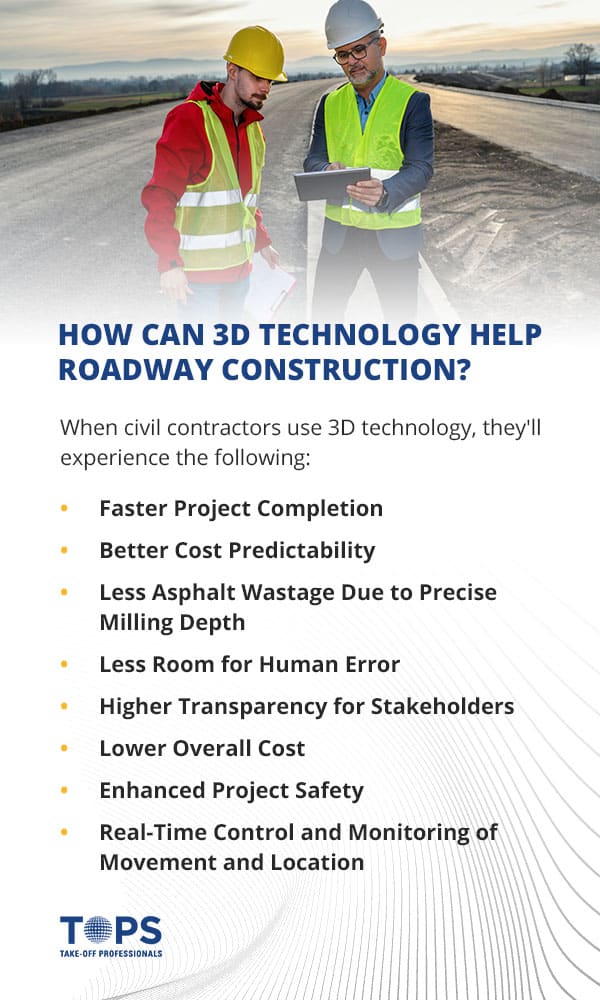
The applications above do more than simply modernize roadwork construction — they benefit it in multiple ways. When civil contractors use 3D technology, they’ll experience the following:
Faster Project Completion
With guidance from 3D-engineered model data, GPS-enabled machinery can operate all day and night and produce accurate grades on the first pass. In addition to decreasing waste and economizing resources, machine-controlled equipment’s first-pass accuracy helps contractors complete their jobs faster.
Better Cost Predictability
A 3D-engineered model lets clients and contractors see all project elements and how they interact, giving them access to the information they need to make decisions. Roadwork construction 3D technology allows engineers to quickly input the items they want to quantify and receive their numbers.
Integrating costs can help build an accurate budget and reduce cost overruns. Options like 5D models incorporate costs into the project. Contactors and clients can see when they’ll receive invoices for materials and when they’ll need to pay.
Less Asphalt Wastage Due to Precise Milling Depth
Using traditional milling equipment to remove asphalt is a wasteful approach. With machine control, operators can adjust the depth of asphalt they remove in real-time, producing less waste. 3D machine control helps the operator optimize the work and make it more precise. It speeds up the overall process and reduces the risk of making a mistake. As a result, the operator is less likely to have to start over, saving both time and money.
GPS machine control technology reduces milling depth in low points of a road, such as potholes, ruts or sunken culverts. At the same time, it increases milling depth at higher points of the road. It also avoids milling too deep, eliminating the risk of penetrating the asphalt to the granular.
Precise milling depth measurements enable pavers to enhance a road’s water drainage profile and produce a smoother surface. They also allow road crews to more accurately determine the exact material quantities they’ll need.
Less Room for Human Error
Few things are more frustrating in road construction than pouring concrete only to tear it back up later due to an error. While 2D construction plans work well enough to design highway systems, there can be disconnects between what’s on paper and what’s in the field. 2D plans usually include cross sections at every 50 or 100 feet, leaving the contractor to interpret the plans in between. This approach presents an opportunity for error. Misunderstandings can lead to inaccuracies, which ultimately result in a loss for everyone involved.
3D-engineered modeling lets contractors know exactly what to expect. With their unrivaled precision and accuracy, digital models significantly reduce errors. When you catch mistakes during the design phase, you can address them for a fraction of the cost of fixing them on-site.
With a 3D rendering, designers can immediately detect if something looks off. The software naturally provides clash detection by showing the entire project — if pipes intersect or contact a bridge footing, it’s immediately visible. 2D plans aren’t capable of displaying these conflicts, but a 3D model is essentially one large cross section, providing a whole new level of detail.
All the items in a 3D-engineered model are spatially related. The designer can view the model from various perspectives, such as elevation and isometric views, which helps them visualize the data. An engineer’s ability to identify design and constructability concerns before the proposal reaches the field decreases the chance of costly errors.
Higher Transparency for Stakeholders
3D-engineered models allow road construction contractors to walk through their projects before they pour an ounce of concrete.
Stakeholders can use virtual reality (VR) or augmented reality (AR) to view the project before getting underway. VR and AR improve communication and help with the integration of ideas. It also simplifies the process, giving stakeholders a clear idea of what they can expect from the project.
In addition to informing stakeholders, 3D technology can help give the public an idea of future developments. Giving the public more insight into these development plans opens the floor to their own input. You can use public feedback to find ways to better serve the community, integrating their ideas into the project.
Those outside of engineering and construction may find it challenging to visualize project elements by looking at drawings. Using 3D models in public meetings can help show laypeople precisely what the project will look like when it’s complete.
Lower Overall Cost
Though it has higher upfront costs, 3D technology can be worth the investment, as it helps civil contractors save money through the course of the project. This more than compensates for the initial design fee.
3D models can cost up to 10% more than the average design fee. While that’s a significant expense, you can save about 4% on the construction project overall. That means a 3D-engineered model for a $500-million project could save you $20 million.
3D modeling provides more precise results, warranting fewer changes and saving time and money. Automating tasks like subgrade, base course and pavement placement eliminates human oversight, reducing room for costly errors.
Enhanced Project Safety
3D technology automates tasks such as staking, stringing lines, drawing fill lines and setting grade stakes. Traffic is one of the main safety hazards for surveyors because it hinders their physical ability to measure the construction site while also putting them in danger of an automobile accident. Surveyors are often in the crosshairs of distracted drivers and other roadside hazards. Lane closures are an effective way of obtaining the data necessary to base map a project, but they require careful planning and significant expenses.
3D technology is a risk-free way to survey a project site. Mobile, aerial or terrestrial light detection and ranging are all surveying solutions that remove personnel from the hazardous roadside. Drones give construction project managers a detailed view of the site. Managers can survey difficult-to-reach areas without extra time delays or safety equipment. Drones are equipped with infrared cameras, radar and rangefinders to perform various inspection tasks.
Real-Time Control and Monitoring of Movement and Location
Intelligent technology like 3D models, on-site laser-based positioning systems and GPS machine control can help engineers control location changes and movement. Machine operators can also perform cuts, fills and grades with high precision automatically or with direction from an onboard system.
Experience the Future of Roadwork Construction With Take-Off Professionals
Our full-time designers work in three different time zones to meet our clients’ needs. We work on jobs of all sizes, from custom home lots to full-scale highway projects, so you can count on us no matter what project you’re taking on.
Predictive data analysis helps companies use data and information to make good decisions, increase productivity and improve safety measures in the workplace. With predictable outcomes for your future projects, you can estimate how much you might need to spend on tasks or identify areas with a higher likelihood of causing injury.
Predictive data brings structure to structureless data. Data common to the construction industry may be hard to analyze or structure into understandable maps and tables. Predictive data analysis helps construction companies monitor important data to make their workplace safer and more efficient.
Benefits of Predictive Data
Using predictive data in the construction workplace has many benefits. Besides the typical benefits of risk reduction and increased safety measures, predictive data analytics reduce the chance of human error and lead to impressive results that will help a company thrive.
1. Risk Reduction
Predictive analytics gives you a lens to better understand data in real-world applications. You can get a good sense of your business structure and understand how to take steps toward a workplace free of incidents or injuries. If you can predict what specific tasks may cause injuries or increase risks based on previous data, you’ll be prepared to reduce risk in the workplace and work toward a successful and healthy team.
2. Less Human Error
The ability to learn from our mistakes is one of the most valuable life skills to have, and predictive analysis follows a similar mantra. With predictive analysis, construction workers can analyze previous data to help them reduce future errors.
Take this small-scale example: If a construction team notices they tend to experience more slip-ups onsite when it’s chilly outside, they can look at previous data to try and decipher the cause of the error. They may realize that the jackets they wear when it’s cold inhibit movement, increasing the likelihood of injury or mistakes.
Predictive analytics makes it easier to make the right decision that will most likely result in a positive outcome for your company.
If you need more computing power and want assistance with accurate decision-making, using predictive analytics can help you. Predictive analysis can reduce human error, which leads to the following benefits for your company:
Ability to analyze large data sets: Predictive analysis uses a large set of data to inform results and records, making the decision process easier.
Faster production: Predictive analysis can produce results quickly, helping your company keep up with decision-making on time.
Improved precision: Predictive analysis data sets are precise and accurate. Accurate data allows your company to make informed and correct decisions about safety, products or materials.
Improved safety: With a better, more precise and faster process, the overall safety of your company and employees can improve. You can make better product decisions and pinpoint areas where safety in the workplace could improve.
3. Impressive Results
Predictive analysis can also help your company and workplace thrive. For example, you can analyze workplace safety over a certain amount of time to see how many workplace injuries occur. Once you have that information, you can use predictive analysis to spot trends, see which activities most frequently lead to injury and make safety improvements to reduce the number of injuries.
You could also use predictive analytics for more than researching and analyzing data. Many companies have recently begun using predictive data and smart devices to increase safety and efficiency in the workplace. Smart devices can predict hazard areas or tell a worker if their actions may result in a possible injury.
For example, Caterpillar, a leading construction machinery and equipment company, began using Cat Smartbands. The device used a wristband with a mounted mobile device to detect fatigue levels in employees. It could also detect severe braking, swerving and inattentive driving when the wearer operated equipment. The Smartbands offered a great way to combine predictive analytics with modern technology to actively increase workplace safety for Caterpillar.
How Does Predictive Data Lead to a Safer Jobsite?
Knowledge of the benefits of predictive data can make construction sites safer. Completing integral jobs can be risky at any job site. While on the job, construction workers may get exposed to chemicals, experience burnout or anxiety or have to operate machinery that leads to injuries or damaged equipment.
The right software can help provide your company monitor valuable safety data. Safety managers can use data to improve workplace conditions through accurate datasets and predictions collected specifically for safety purposes. Remember that collecting unnecessary information about other kinds of predictive data may alter your safety analysis. If you intend to reduce safety concerns, keep your data analysis concise.
Some examples of data categories your company may want to explore include the following areas:
Reported incidents: A description of the safety incidents reported and details about each type of injury or accident.
Incident rates: The rate of recordable safety incidents in the workplace or warehouse.
Injury costs: The cost of each reported injury, including medical bills, worker compensation and other money spent on repairing the damage.
Training and certification: The kind of certifications or training each employee has received concerning the workplace and each reported incident.
Safety incidents: Incidents related directly to safety violations when using heavy machinery and equipment or operating in the workplace.
Fleet accidents: Accidents related to fleet operations and the details surrounding the accident and injuries.
Tools: The tools used during the incident or any devices used during the day.
Design elements: Specific design elements of equipment, machinery or tools that led to the injury.
Compensation: Details on worker compensation related to injuries or incidents, including amounts and frequency.
Severity: The severity of the injuries or incidents.
Experience levels: The experience levels of employees in the workplace and those involved in the incident or injury.
The information provided through these data points can help your safety workers, managers or inspectors create a better work environment. Predictive models help your company pinpoint the exact areas that need immediate improvement.
Find out what led to injuries and where they occurred. You can also discover what equipment and tools are most likely to cause potential injuries and work to reduce safety hazards. Knowing the possible cost of injuries can also encourage a decrease in workplace injuries.
Consider the legal aspect as well — predictive data analytics can help create an accurate timeline of claims and injury costs. Information on your claims may become part of the litigation process, and a detailed account of each incident can assist stakeholders, CEOs and workers in reducing injury-related losses.
Getting Started With Predictive Data Analytics
Now that you understand the benefits of predictive data analytics, it’s time to get started collecting data. Before diving in, you may want to become familiar with the different areas of predictive data so that you’re fully prepared for every step. Here are eight essential factors to consider.
1. Focus Areas
One of the best ways to get started with predictive data analytics is to identify focus areas to create an efficient process. Remember not to choose areas that are too broad to ensure you get accurate results. You want to use your time — and data — efficiently.
Choose one or two focused areas to create a predictable analysis of data. Your data can help you anticipate and mitigate safety hazards, improve quality and reduce safety issues. With more visibility into risky projects and equipment, your company can prepare for every safety hazard and reduce the number of injuries each year.
2. The Right Tools
You can also use past data to grasp how tools have contributed to injuries to choose the right tools for the job. Using the right tools in the workplace is an essential part of risk management. It can also help you reduce costs and increase safety. After analyzing the differences between tool types, you can evaluate each one’s performance and work to mitigate risks in the workplace.
Safety managers may especially benefit from predictive analytics relating to tools, as they can predict potential behavioral hazards related to tool usage and work to implement better safety practices. Taking proactive measures using accurate data can help top managers and executives in the company identify and reduce risks before they become an issue.
3. Standardize and Centralize
Predictive data analytics also offer a helpful way to centralize and standardize your company’s data. You can provide structure to your company through proper research and reporting. Employees and managers can better utilize the information for hazard mitigation when they know where to find it.
Many companies enjoy that standardized data allows them to explore future technology in the workplace, such as machine learning or AI. Analyzing such options can help increase areas like project delivery and create an efficient company in and out of the workplace.
4. Budget Management
Your company must pay attention to each project’s financial and budget management forecasts during construction projects. For example, you may be required to monitor budgets in real-time, identify cost overruns or anticipate cash flow problems. These tasks are made easy with predictive data analytics that can quickly research and run data about anticipated financial risks and issues before they occur.
Your company can also use predictive data for the following purposes:
Finding equipment to purchase: Use predictive data to buy the right equipment or machinery in the future.
Deciding whether to purchase or lease: Decide when it may be best to purchase equipment or lease machinery for a project.
Predicting revenue and profits: Monitor and predict your overall profit and revenue for every project.
Discovering staffing needs: Decide what staffing requirements may be necessary for each project.
Choosing future projects: Predict what tasks you may complete or acquire.
5. Easy Access to Information
Predictive analytics may also help you make informed decisions and encourages companies to provide easy access to data and information across teams. Many companies remain dependent on paper information in the construction industry, but adopting paperless data helps keep necessary materials stored in the cloud rather than binders. From stakeholders to contractors or third-party employees, people will benefit from easily accessible information. It also increases team members’ communication and collaboration while improving employees’ planning and decision-making.
6. Efficient Reporting
Many companies in the construction industry have relied on paper-based reporting in the past, which may lead to problems in the future, as papers may go missing or essential reports get lost in messy offices. Even subcontractors could get behind on filing paperwork, making the construction process challenging and inefficient or leading to delays.
Paperwork can also make it difficult to visualize data accurately or compile large amounts of information. With digital predictive data analytics, you can easily access reports online. Digitization saves time and helps companies avoid accessibility problems or human error during data entry.
7. Increase Worker Safety and Productivity
Remember that one of the main benefits of predictive data analytics is improved safety and productivity in the workplace. Data can help you maximize your productivity by keeping workers engaged and saving time and money that you might otherwise lose. Overworked or burned-out employees may result in overtime costs and high employee turnover.
Predictive data can help you pinpoint areas of improvement and trends in injuries and accidents during the day. With the right data, you can fix the problem and find areas where you could continue improving your workers’ conditions. You’ll see that efficiency and workflow increase significantly once employees work in a safe and healthy environment.
8. Dispute Resolution
Resolving disputes is a common problem in the construction industry and can result in costly resolutions. Predictive data can help your company find areas where conflicts may occur, such as progress or project status, time spent on projects and cost related to projects. Material usage or quality of material may also be a common reason for disputes. Understanding these key areas can help you create and analyze data sources to find the truth for both parties during a dispute. Using predictive data, you can reduce the chances of needing dispute resolution altogether.
Predictive Analytics: A Summary
With all this information in mind, you can leverage predictive analytics by using historical data to predict safety hazards or future events. Creating a safer workplace starts with informed decision-making, which is only made easier with predictive data. You can prevent problems before they exist with accurate data, reducing injury costs and safety hazards. With informed data in mind, your company can identify opportunities to improve workplace processes, operations and safety procedures.
Use Predictive Analytics at TOPs
At Take-off Professionals (TOPS), we offer 3D data for machine control and layout. From grading surfaces to layouts and utility trenches, our products assist rovers, machines, pavers and more. With predictive data analytics, your company can use our quality takeoffs to estimate the cost of a project, including the attributes and quantities of materials you’ll need to complete it.
From schools and commercial sites to streets, highways and home lots, our predictive data allows your company to use the right tools, materials and quantities at all times. Your company can become the most efficient and safe it has ever been. Contact us today to speak to a representative, or call us at 623-323-8441.
Innovation strategies can mean progress in any industry but especially in the construction industry. Innovation can mean you deliver greater value to customers and work more efficiently. However, because of tight profit margins and risk, innovation or change isn’t always welcome. The right innovation strategies can help you reduce risk and increase your and your customers’ return on investment (ROI).
For any innovation strategy, you must make some changes. These changes could include everything from new methods of handling project planning, labor productivity, safety issues, document management and information sharing to budgeting and addressing overruns in scheduling or costs. At TOPS, we want to help you reduce risk and increase your ROI.
Innovation in Construction
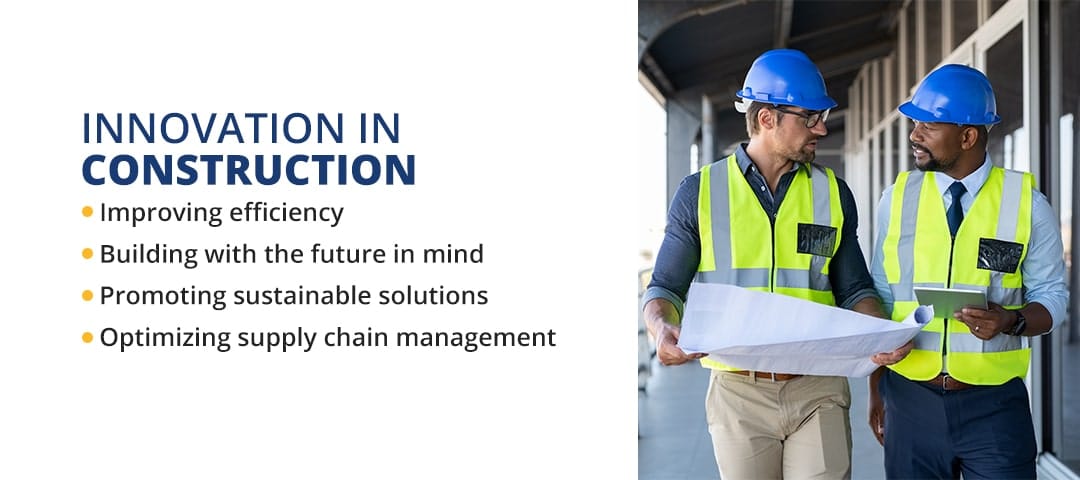
Innovation is change and an openness to improving services, processes and products. Innovation is key to solving challenges you face at your work sites. In the construction industry, heavy equipment, complex materials and big machinery provide more ways to get the job done than ever. However, innovation has been a bit slow in construction compared to other sectors because innovation is expensive, lacks standardization and requires significant research. Shortages in labor and material availability can also hinder innovation. In this industry, you can foster innovation by:
Improving efficiency: Improve the efficiency, productivity and quality of your work in the construction industry with a monitored and connected job site.
Building with the future in mind: To build with the future in mind, use smart technology, new energy sources, better resource and asset management and innovative construction materials and methods.
Promoting sustainable solutions: Many in the construction industry are innovating to promote sustainable solutions that can reduce their environmental impact.
Optimizing supply chain management: Optimizing your supply chain management can make it easier to track fleets, improve inventory management and obtain services and materials.
Measuring Return on Investment
You can measure your ROI both internally and externally. Internal ROI includes process, profit and people.
Process: This factor focuses on efficiency.
Profit: This factor concentrates on the impact on your bottom line.
People: This factor refers to employee engagement and skill level.
External ROI, on the other hand, includes competitiveness, community and customers.
Competitiveness: This factor refers to how you show your competitive edge to win better projects.
Community: This factor looks at how you manage and organize the subcontractors and supply chain within your professional community.
Customers: This factor assesses how you acquire, keep and encourage repeat customers.
In measuring ROI, many hard metrics depend on cost and time savings. Some softer metrics are helpful to evaluate in times of high demand, fewer materials, sustainability and fewer people. For example, if you want to replace a manual task with software, you must first analyze whether doing so would save money and time and ensure accuracy. Workers should also feel positive about working with the software, and the software should improve performance and make the job easier to perform.
Increasing Return for Earthworks
To increase your ROI for earthworks, you should understand how to ensure a successful earthwork takeoff. Earthwork is the engineering process in which soil, rock and similar materials are removed, moved or added to change a location’s topography. To increase your return for earthworks, you may want to invest in earthwork estimating software. Some of the features of this software include trench profiling, grid views and strata layer breakdowns.
Introducing New Technology
Technology is the cornerstone of the construction sector’s innovation. From the latest technologies that facilitate sustainability to digitalized solutions that promote productivity, technology is essential to the industry. The goal is to identify new technology and tackle the challenges you have been facing.
To introduce new technology into your work, you need to take a strategic approach. To determine the right technology for a project, identify who will be impacted, lay out the process and choose the technology that improves the process.
Identify employees: Determine who will be using this new technology or who will be impacted by it. Consider the current level of understanding and the level of understanding and awareness you need employees to have. With your team, communicate both the how and the why of this new technology.
Lay out the process: Next, lay out the process for which you want to use this new technology. The technology should improve this process or help you determine whether you should implement a new approach.
Choose the technology: Finally, select the right technology to improve your work. If you are unsure how to make this selection yourself, turn to the Take-off Professionals for help.
New technologies can make job site workers safer and overcome mobility restrictions with technology that aids in the delivery of materials. Today, artificial intelligence (AI) and robots allow construction professionals to work remotely without pausing their projects or exposing themselves to illness during a pandemic, for example. New technology can open the door to other innovative solutions in the construction industry.
Civil contractors use many machines, such as dozers, soil compactors, pavers, asphalt compactors, skid steers and machine control motograders. If you’re a civil contractor, you may also utilize full-scale aircraft or drones to capture data with photogrammetry. If you don’t already use this technology, these may be new tools you want to implement.
If you’re a surveyor, point cloud modeling is one example of new technology you may want to use to conduct land surveys more efficiently and easily. Point cloud modeling uses fewer resources while still accomplishing the same work. Point clouds are collections of several small data points that each represent part of a surface in a specific area like an engineering work site. Together, these points form a 3D structure. At TOPS, we use point cloud data as part of our 3D earthwork modeling.
Learn From Our Trainers at Take-off Professionals
As the experts in all things data, TOPS creates 3D data models for machine layout and control, including 3D utility layout, grading surfaces and utility trenches for machines, rovers, pavers and curb machines. We provide earthwork takeoffs with mass haul analysis for roads and sites, material and dirt quantities. Additionally, for the project’s life cycle, we create haul roads. To help boost your productivity on a construction site, we offer the following services:
To build the best 3D models, our team is composed of only full-time employees. Our focus is entirely on data preparation and modeling, so you can rely on our expertise. If you are a busy contractor in need of support with takeoffs and the right technology, we can help. Contact us at TOPS to learn more about reducing risk with construction innovation strategies.
Finding volume with contour lines is essential to your business operations. Increase precision by calculating volume from topographical 3D models.
What Are Contour Lines?
You can find contour lines on topographical maps. These lines define the elevation levels of a particular terrain. Contour lines with a wider distance between them indicate a more gradual slope. If they’re close together, that means that the elevation is steeper.
Contour lines represent an area where all locations on that line are at the same height. We use these lines to determine the elevation and topography of a landscape. In the case of construction work, surveying the land can help you decide where to locate new structures and where you may need leveling work.
Ensure Material and Budget Accuracy with Our Help
At TOPS, our full-time professionals specialize in creating 3D topographical models using your data. These precision models, vital to any earthwork project, aid in optimal usage of materials and budget. Access our online platform for comprehensive oversight of your data and models.
You can determine volume using contour lines in two ways:
Prismodial method: This method offers a precise way to get an estimate of the volume. The formula is generally known as Volume = L(A + the square root of (A*B) + B) divided by 3.
Trapezoidal method: This method is also used in calculating volume with contour lines. The formula is Volume = L x 1/2 (A1 + A2) cubic meter.
Why Is Volume Calculation Important for Earthwork?
Measuring the volume of the land at your next project is vital for several reasons. First, if you want to create an accurate bid for the work, you need to know what type of landscape you’re working with. Using contour lines and topographical maps to determine volume will give you an idea of the work you’ll need to do. Then you can more accurately account for labor and material costs.
On that same note, calculating volume in an earthwork project also allows you to use your materials effectively. When you know the volume of the area, you can take the guesswork out of how much material you need for a particular project.
Contact Take-off Professionals for More Information Today
At Take-off Professionals, we use your data to create 3D topographical models. We optimize what you gather from a quantity survey to make models with contour lines to determine volume. Ensure material and budget use and accuracy with our help.
Our team is composed of full-time professionals who work on these projects as their specialty. We focus on creating dependable 3D models to use for determining the volume of the terrain for your earthwork.
You can access our online platform to view your data and models. You can even add other files or notes to keep all related materials in one place. Take-off Professionals has over 20 years of experience and works on around 1000 3D models yearly.
We offer detailed quotes that describe the exact services you’ll be getting. Our turnaround times are quick too, ensuring that you can get your work done on time. We have trained professionals on a national scale, meaning that we can help you no matter where you live. For more information about our 3D modeling services, please get in touch with us online or call 623-323-8441.
A 3D model lets a civil contractor or construction professional perform machine control and layout planning before and during construction. Depth map sequencing and point cloud modeling are two examples of 3D modeling often used in construction. Although the two methods have some things in common, they ultimately have different goals and purposes. A point cloud is usually a collection of data points that form a shape, while a depth map conveys information about the distance between two objects in space.
Learn more about the differences and similarities between point cloud modeling and depth map sequencing below.
Exploring Point Clouds in 3D Modeling
Point cloud modeling produces a set of small data points, which exist in three dimensions and on X, Y and Z coordinates. The data points represent a part of a surface in a defined area, such as the area of a construction site. When arranged together, the points produce a clearly identifiable structure.
The more data points in the point cloud, the more detailed the structure and image will be. You can compare the data points that make a point cloud to the pixels that make up a digital image. The more pixels there are in an image, the clearer the picture is.
Techniques for Generating Point Clouds from Depth Maps
Two methods can produce point cloud models — photogrammetry and Light Detection and Ranging (LiDAR), also known as remote sensing.
Photogrammetry
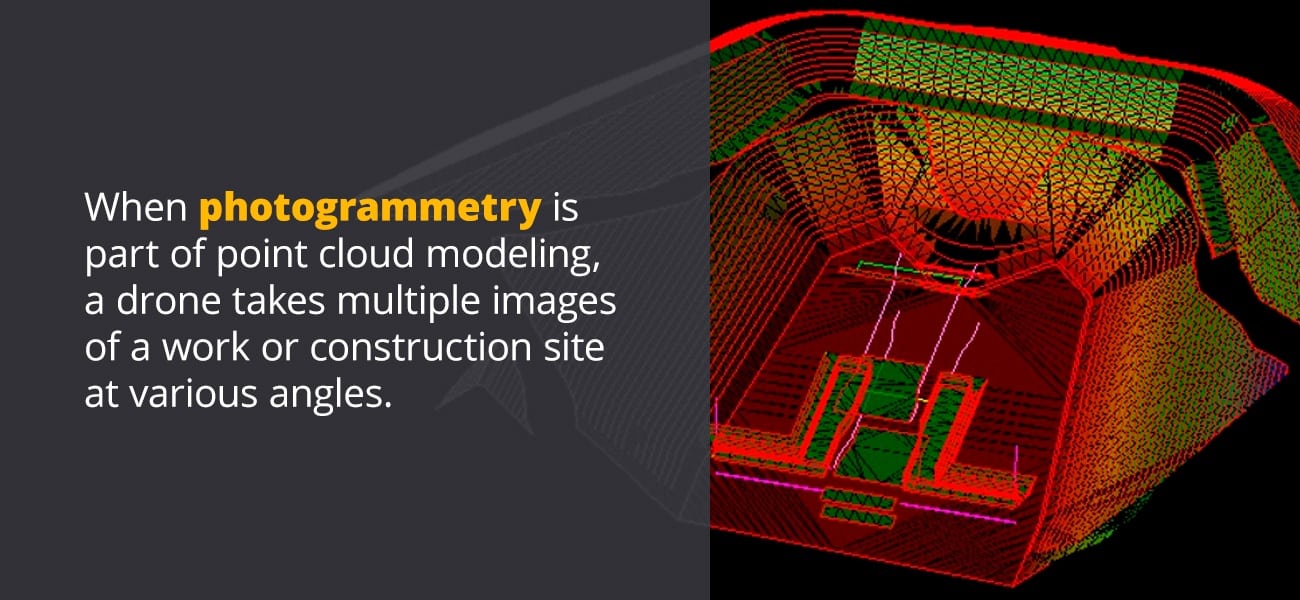
Photogrammetry is a relatively old process of collecting information about objects and surfaces. When photogrammetry is part of point cloud modeling, a drone takes multiple images of a work or construction site at various angles. After the drone takes the photos, the images are collected together and processed. Processing the images stitches them together, creating an overlapping picture and allowing you to build a 3D model from them.
While photogrammetry uses images to help you produce a 3D model, LiDAR uses laser beams. Typically, a device that transmits a laser is attached to an aerial vehicle. The vehicle goes up into the air, directing laser beams back to the Earth. The laser beams bounce off the Earth’s surface, returning to the vehicle.
LiDAR measures how long it takes for the laser beams to travel from the surface back to the aerial vehicle. In some ways, it is similar to echolocation, except instead of using sound waves to measure distances, LiDAR uses light beams. The information collected by LiDAR can then be transformed into a 3D model. Once the images or information is collected, the process of transforming them into a 3D model is similar for both photogrammetry and LiDAR.
Often, LiDAR collects more useful information than photogrammetry, particularly if there is dense tree cover over the area being measured and modeled. A photo can’t push through branches and leaves to give an accurate measurement to the ground below. A light beam can travel through the spaces or openings in the tree cover, allowing you to see how far below the ground is.
One drawback of LiDAR is that it can be more sensitive to weather conditions than photogrammetry. It can also have difficulty collecting accurate information when the surface is reflective.
Applications of Point Cloud Data in Various Industries
Point cloud modeling has several uses in construction and engineering projects. You might need to create a point cloud for the following:
Surveying: Point cloud modeling can quickly and cost-effectively produce representations of roads, bridges and other complex structures.
Earthworks projects: Earthworks projects, such as excavating to produce a new road or lay pipe, can also benefit from the use of drones or aerial vehicles and point cloud modeling. Point cloud modeling allows your company to keep tabs on a project without visiting the site in person. It can also help improve worker safety on-site.
3D models: Point cloud modeling also allows for the construction of more accurate 3D models for a project. The data captured during point cloud modeling allows you to accurately identify and distinguish objects in the area so you can create a precise representation.
Advantages of Using Point Clouds for 3D Representation
If you need to create a 3D model for an engineering or construction project, using point cloud modeling offers multiple benefits:
Accuracy: A point cloud model is an accurate representation of an object or area. Both photogrammetry and LiDAR allow you to capture enough information to produce a detailed, correct model of a particular area.
Ease of budgeting: Since the process of capturing information for point cloud modeling is so accurate, you can develop a budget for your project without too much concern about going over or spending more than you can afford. Point cloud modeling also minimizes the risk of mistakes, meaning you will spend less time and money on correcting errors. You will also save time on your project, which translates to cost savings.
Efficiency: Point cloud modeling is a much more efficient process of building a 3D model, especially when compared to the time and effort it would take to create 3D models by hand. Increased efficiency means your project gets off the ground and can be completed sooner rather than later.
Understanding Depth Maps in Detail
A point cloud lets you see every data point used to create an image. A depth map gives you a view of the data points from a particular angle. Another way to look at a depth map is as a 2D image that has been manipulated to look like a 3D image. A depth map has information on the distance between objects in a picture. It’s often shown in grayscale.
After the creation of a depth map sequence, the grayscale image is usually merged with the initial photo. Combining the two creates a third picture that looks 3D.
Crafting Depth Maps: From Capture to Model
To create a depth map, you start with a 2D image. Since the goal is to turn a 2D image into a 3D one, the source image must have several layers. Ideally, the starting photo will have a background, middle ground and foreground. To produce the depth map, you’ll need a photo and an image-editing program, such as Photoshop.
Start by selecting areas of the foreground, using the magic wand or another selection tool to trace them. After tracing each section, create a layer. Once you’ve selected and created the layers for the foreground, select the part of the image that makes up the middle ground. After that, select the section of the photo that will be the background.
After selecting and creating the layers for your 3D image, grayscale each layer. The layers in the background should be a darker gray than the foreground layers, which should be the lightest gray. You might find it easier to work if you grayscale the image before you begin cutting out the layers.
Once you’ve produced the grayscale image, you’ll merge it with the original picture in the photo editing tool. The overlap of the two images produces a photo that looks 3D.
The Role of Depth Maps in 3D Visualization
One use of a depth map sequence is to create 3D advertising images. Another use is for producing 3D models for engineering and construction projects. Compared to a flat image, a depth map lets you see what is around or behind objects in a picture, providing you with a more accurate presentation of the area.
Depth Maps vs. Point Clouds: Delineating The Key Distinctions
The primary feature that point cloud modeling and depth map sequences share is both use images to transform data into 3D models. The two methods give you a way to view information.
One of the differences between depth maps and point cloud modeling is the image’s viewpoint. A point cloud lets you see every point. A depth map only gives you a view of the points visible from a particular angle.
Another way to look at the differences between a depth map and a point cloud is to consider the image’s dimensions. Cartesian coordinates include an X-axis and Y-axis, which intersect each other perpendicularly. X and Y axes are all that is needed for 2D images.
When an image is 3D, there’s also a Z-axis, which intersects the X and Y axes and runs vertically. X and Y are horizontal. With a point cloud, you can see the image from all three axes. In contrast, a depth map only gives you the information found on the Z-axis.
Expertise in Data Modeling: From Depth Map to 3D Model
Your project’s success depends on what you do with your data. The team of experienced engineers at Take-off Professionals (TOPS) can transform your data into a working 3D model. All you need to do is send us your plans and the CAD files and we’ll take care of creating the point cloud models. To learn more about our services and the benefits of working with data modeling experts, get in touch with us today.
Several of my recent blog articles have been on data collection and use. Many readers have responded with the same questions. With data coming at me like a fire hose, how do I safely store and retrieve it? Being married to a professional landscape photographer, I learned years ago about putting large amounts of data in a safe place for future use. One advantage we have is that all our data may not need to be saved forever and a post job purge can reduce overall usage.
I will talk about different data storage methods and their advantages. I will not name companies. A search of product and service types will give you a wide range of options. When working on a project, some of the files will be kept on your local machine. To be proficient after some operation(s) are performed, you can move files to a remote location to stop your computer from slowing down.
The Desktop
Do what you need when a project is ongoing. In some cases, we dedicate a hard drive to a project and then store it after the project is completed. Hard drives can range from 100 megabytes to over 10 terabytes. Disk size for hard disk drives (HDD) can be over 20 terabytes at a reasonable price. Here are the best practices for desk side storage.
Have a large (2TB+) solid state drive (SSD) for Windows and other programs.
Have a second solid state drive for file storage. We have added multiple SSD’s for expanded storage. Prices are low and performance is required for data modeling and photogrammetry.
Keep things on the drive as the project goes along. Remote storage is good, but a lot of files may need to be brought back to the SSD’s to do some more work.
I have not mentioned backup of your local machine yet. We will cover local (somewhere you can get to easily) and cloud backups. Remote backup is also another option.
Local Backup
The easiest way to make sure things are safe is to back up your hard drive and put it in a fire safe. A process that is time consuming and prone to forgetfulness. I do not recommend this as there are other solutions.
Network Attached Storage (NAS)
NAS is the easiest way to grab something, work on it, then put it away safely. As the name implies, you have a large amount of storage that is connected to your network. It is a drive that is labeled as a letter, I use “N” for simplicity. The drive itself acts as a small computer with a disk array for redundancy in case of partial failure. Transfer speeds are generally good making it easy to retrieve and save data. There are other benefits as well.
Another NAS drive can be placed offsite, giving you added protection in the event of complete destruction of one of the locations or its drive. I did this for our firm years ago and had a host of issues getting things set up. There are a number of independent consultants who will do this in a matter of minutes and it is well worth the money. Here is a road map.
Find a technician to set up a NAS. The brand you buy will depend on what the technician recommends.
Decide on the amount of storage you want. The technician can help with that.
You will get two NAS drives. One will go in the office, the other in a remote location that has a fast internet connection.
Both drives will start out in the office, the initial large data transfer will be easier that way.
The drives are synced and tested while in one location, this makes troubleshooting easier.
The second drive goes to the remote location.
Drives can be set to back up continuously or at a specified time, usually early morning hours when no bandwidth is being consumed
This peace of mind is critical in securing your data information. Also make sure that important accounting data and correspondence gets saved from other staffers and departments in the office. The cost for this is less than you may think, and you can avoid sad stories of lost data and ransomware.
Cloud Backup
Whenever I mention the possibility of using cloud backup, I often get a response related to security. First, platforms like Dropbox are secure and second, the plans and files you are saving are usually public domain if somebody wants to look them up. How tragic is it if somebody sees the CAD for a subdivision anyway? The exception I will agree is sensitive correspondence, financial information, and most internal communication. Use the NAS for that and trust the rest online. Here is the process.
Decide on the platform and storage limits. Prices can vary widely so shop around. Security is similar with most so do not let that be an issue.
Decide on what to sync. I use the sync folder as local access as well because the data resides locally and is mirrored to the cloud.
Depending on your connection to the internet, you can choose to continually update or pick a specified time. This is usually in the early morning hours when you are hopefully not working, and speeds are good.
A dashboard for the program will keep you posted with the status of a sync.
This easy solution may be the best option due to the protracted setup of a NAS. If you have followed along to this point, there is still the possibility of accounting and correspondence not being saved. Do not delay the install of a NAS too long.
Purging Stored Data
We never really get rid of information completely. After a time, we save a distillation of information and lock it away. You may also want to check with your attorney as to how long they feel you should have full saves as opposed to the reduced density mentioned. Here are some examples.
Regarding machine control data, we save the latest file we made in the native software and the last files sent to the field. The pdf’s can be saved as well. Sometimes if they are huge, we will strip out pages outside our scope. Remember they are generally available at the agency responsible for approvals. Let them warehouse it. We do not need the original CAD files.
Photogrammetry jobs get saved as the point cloud and GEO-tiff. Raw images and initial surface production can go away. With the point cloud we can generate what is necessary in case we need to go back. That will save a ton of space.
Takeoffs can usually be the program file we used for the numbers. No reports need to be saved as you can run them again. We save the pdf sheets associated with the takeoff as well.
Job notes and correspondence can get saved in total. They are almost always copies of emails and letters that take up little room. I have spent more time than it is worth trying to decide what should stay and the space saved is minimal.
Well, there you have it. A comprehensive plan for saving and securing data. The pandemic has changed everything and many of you are working at home and need access like as if you were in your office. When I started this company, we all worked remote and were on the cutting (painful) edge of a lot of the previously mentioned technologies. Things have gotten much simpler and integrating some or all these ideas will give you a piece of mind. There are a lot of horror stories out there regarding lost or stolen data. Hopefully, you will not be one of them.