The urgency to start projects and complete them quickly has become common. No matter what the use, the quicker the job is completed, the faster it’s used. Being first on the site, civil contractors generally have the least complete plans to start with. Owners do not understand that we need to know what the project is going to look like before we start planning. I have set some baselines for producing data for fast tracked projects that makes things easier for everyone.
There are three models that we will end up building which represent three distinct phases. Here are descriptions of the three basic model types for clarification.
Mass Excavation: This represents the bulk cuts and fills on the project. Expect no better than 1-foot accuracy.
Mass Grading: This brings things within a tenth. Retention and landscape areas should be good, and the building pads and parking areas may not be finalized.
Fine Grading: This is the final detailed information. Entries, parking, and building pads are all finalized as well as specifics for landscape, walks, and installations on site such as benches and playground equipment.
It seems no matter how much information we get, we always need more. I will go over the information we need and how to build each of the three models. Communication with all parties is critical. The example used is for an apartment complex. The owner is not sure how many units to build. Pre-leasing will help in that decision. In the meantime, pads, parking, and common areas are not finalized. We will work with engineers to make sure the contractor only moves dirt once and the project keeps running.
Mass Excavation
A “complete” set of plans needs to be submitted for approval. After permitting, things always seem to change. In this case, we will get enough information together to have scrapers and dozers working.
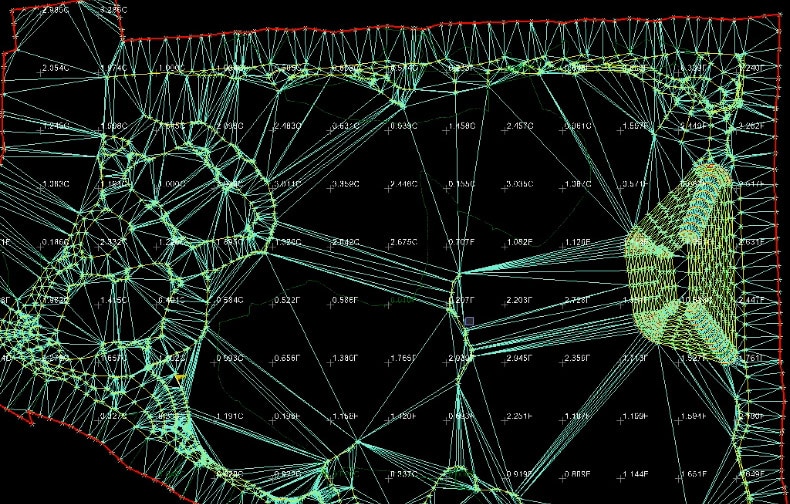
Before the crew gets to localize the site, equipment is moved in. We provided two different PDFs for use in the field. This may seem like something to keep the owner happy, but I want the work to count. The PDFs contain a 50-foot grid for cuts and fills. It’s enough for a couple days until the GPS can be set up on site and the real work begins.
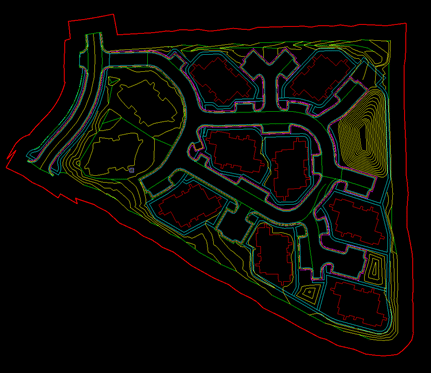
As you can see in the image, we had finished contours for the retention to the east and rough grades for future pads. The bulk of the work is the buildings that are in the central area.
The plan set shows buildings and related access. With changes coming, we will smooth out the area and make some haul lanes. This is not a big site so we either need to start detailing or the contractor will have to leave, something that the owner does not want.
Even if the buildings change, we can get close to finish because there is usually not much elevation change between the pad and the paving areas. The biggest concern is not to build pads that are too big. This job required special compacted fill for the pads and the cost of an oversize pad would be substantial.
Summary
We can generally use the contours to get started. With larger cuts and fills, the time to get to the next phase is longer but the urgency is still there. Too much dirt moved or placed is not acceptable. Here are some tips:
Get a good OG topo. LIDAR or a drone topo is the way to go. Do not trust the contours from the plans if possible.
Be sure to get major drainage in at this point. No sense in making temporary ditches to move water.
If roads are being built, consider using that path for haul roads. Final grades can be cut on this well compacted surface easier than loose material.
Mass Grading
When we build this model, we know general footprints and elevations. I want to get things as close as a tenth of a foot. To do that, a lot of things need to be in place.
Pad sizes and elevations.
Streets should be close to finish. If the pads are good, street elevations are usually related to their elevations.
Utility rims and grates are set to finished elevations.
Parking lots are not detailed but close enough to rough things in.
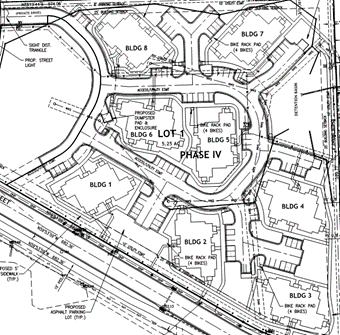
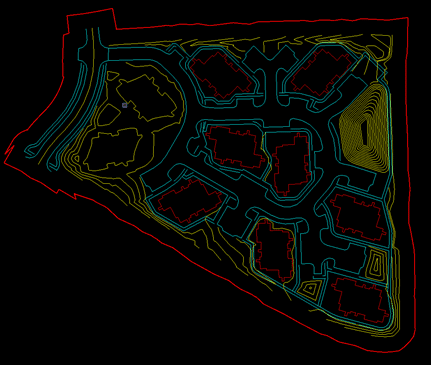
For this job, I set the building pads to elevation and size. They will be handled as their own sub-set due to select fill and compaction requirements. The curb is laid out and we have a good idea of the 2D location. Final elevations will be worked out in the last file.
As you see her, the design looks complete. It will allow the contractor to get the pads done and rough in the streets after the utilities are placed. I like to square up the pads, as that is the way they will be built. In this case they requested the actual layout.
When you are doing a job like this with a lot of detail in a small place, it is important to manage material. There is not a lot of room for excess dirt and we need to be careful with frequent drone topos to get rid of just enough material.
Summary
In a perfect world we could reduce files to no more than two. That is often the case if the rough grade file is ready to go and in a week we have the final information needed to make the fine grading surface. With the job described, the contractor needed plans to get them closer to finish without the final plans being ready. The rough grade file can buy the office some time to get the fine grading file ready. It’s important to walk away from a job and look at it with fresh eyes in the morning to get the last breaklines and spots for better performance.
Fine Grading
With one more opportunity to get questions answered, we now create the fine grading surface. Here is what we are going to produce for this surface.
Retention areas to the correct volume required for the changes in the project along the way.
Correct slopes away from buildings for drainage.
Streets that drain to properly sized inlets.
Intersections that work with traffic and shed water. No humps in main streets that will not work with posted speeds and pullouts and deceleration lanes that drain.
Sidewalk ramps to ADA standard with sidewalk cross slopes at less than 2%.
Parking lots graded to move water and contain no abrupt slope changes to catch low front scoops.
As many breaklines and additional spot elevations required to make all the above work.
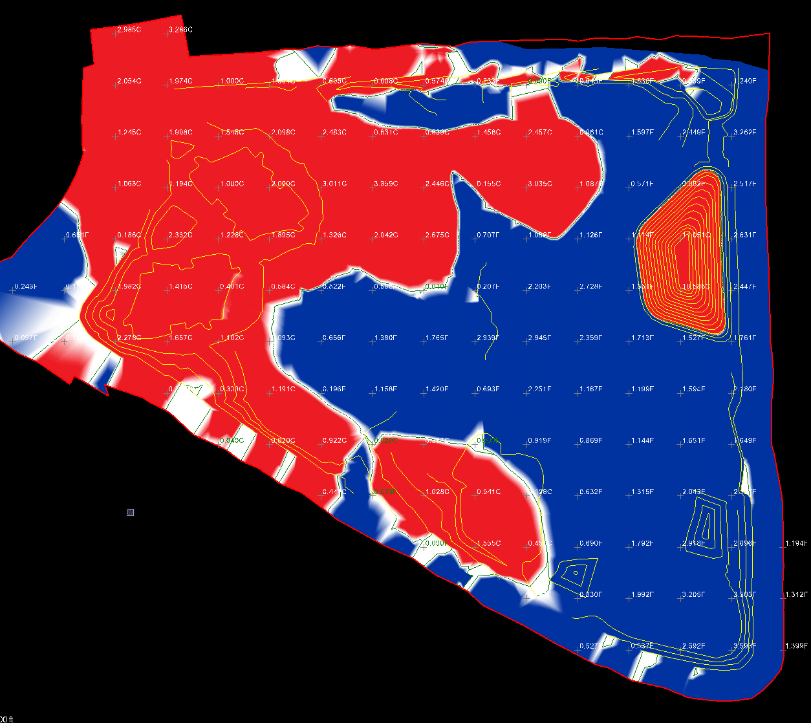
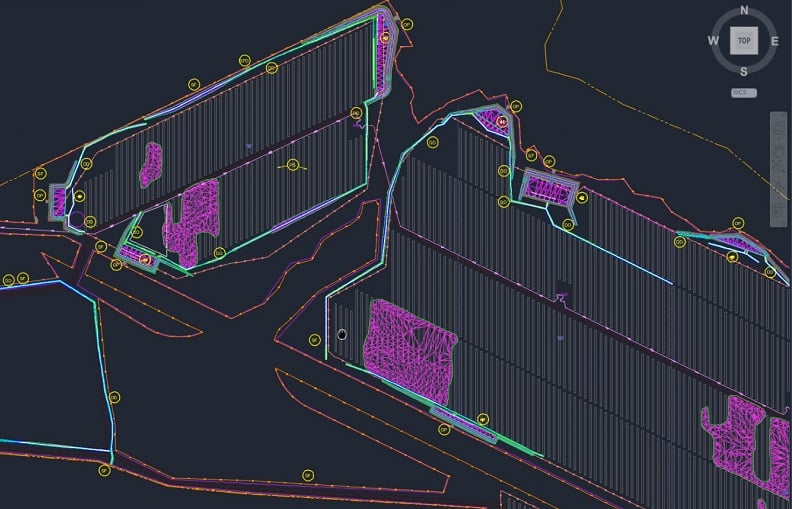
As you can see from the image, we added a lot of information to make the final file. These details will make the model perform better as well as give the contractor a look at what will be required to finish the project.
The green lines in this model are breaklines done by our engineer Michael Stallings, to help the surface do what we want. These are 3D lines that connect elevations on the surface to make sure the TIN links with correct elevation points. Of all the things in a model, the breaklines are the most confusing for new model builders. There is no easy answer. You need to draw a breakline in an area the does not look right to see if it improves the performance. If it does not, delete and try something else.
Summary
You want the fine grading file to be sent out last. We have had jobs where we sent out ten files as revisions and updates. The fine grading file should be a finalized surface of the information you have. If you do not have that, do not call it fine grading. The field needs to understand what the different file types do and know the tolerances placed on them.
Conclusion
Many times, we can get one file out the door with all the information needed built at once. We only hear from the contractor for the next job. I hope you have the same result and do not need to send multiple files. The following process will save you time and trouble.
Keep file names consistent. If you use “Mass Grading” use it every time. The field will know it is close but not final, they can work with that in mind.
Put dates on every file. It saves confusion.
No need to bring a lot of equipment to the site initially. Start with some non-GPS machines for initial work and bring in guided equipment as things get moving.
American suburbia is practically synonymous with cookie-cutter houses, carefully manicured lawns and winding roads. Another staple of these types of neighborhoods is the cul-de-sac. These road designs have been used in suburban planning for the better part of the last century, increasing in use alongside American car-ownership. While cul-de-sacs are necessary in residential planning, however, they pose significant challenges for those involved in the planning. In particular, designing a 3d model cul-de-sac can be difficult due to the unique geometry involved. For this reason, we’ll cover the basics of cul-de-sacs in city planning, how to draw a cul-de-sac in AutoCAD and how Take-Off Professionals can help simplify the process.
What Is a Cul-De-Sac?
The cul-de-sac has been a common feature of the American suburb since the mid-20th century. This French term translates to “bottom of the sack,” and is used to refer to a dead-end street where the only outlet is the entrance. These suburban road designs are a direct result of the American motor age, purposefully created to allow for more spacious property facades while simultaneously encouraging slower car movements.
Cul-de-sacs were first used in 1928 in New Jersey, but gained popularity in the 1950s as car ownership boomed. The design gained further popularity as engineering studies on residential street safety encouraged more discontinuous street systems like cul-de-sacs. These studies found that such designs reduced the number of motor vehicle accidents compared to grid-based designs, and generally encouraged safer driving practices. Both features proved to be highly desirable for the more family-centered residential neighborhoods.
How Are Cul-De-Sacs Designed?
While it is simple to describe a cul-de-sac as a dead-end street, there is much more that goes into the design. Cul-de-sacs vary in road length but are typically designed with wider-than-normal road widths to allow cars to park along the sides while still allowing residents to enter and exit. These roads may be even wider if driveways are placed along the roadway. The defining feature of the cul-de-sac, however, is the wide, circular termination. This termination is where most of the residential driveways are placed. Cul-de-sac terminations are typically 100 feet or more in diameter, which allows cars to easily maneuver in and out of driveways and service and emergency vehicles to turn around.
Cul-De-Sacs in Neighborhood Planning
Homebuyers desire cul-de-sac-based communities for their safer streets, neighborly environments and lower crime rates since criminals tend to avoid confusing street patterns that make for more difficult getaways. While these features make cul-de-sacs more desirable for residents, planners favor them as well. Here are a few reasons why:
Reduced infrastructure costs: Cul-de-sac patterns require significantly less road and utility construction compared to grid patterns. Grid patterns require up to 50% more road construction and 25% more water and sewer line construction.
Improved topographical adaptation: While grid patterns blanket entire regions with invasive infrastructure, discontinuous cul-de-sac patterns can be designed to work around areas that may be more topographically challenging or ecologically important.
Decreased standards: Because they do not carry through-traffic, city regulations often do not apply in the same way to cul-de-sac-based neighborhoods as they do to grid patterns. As such, planners have less to worry about with regards to street widths, curbs and sidewalks.
These planning advantages make cul-de-sacs beneficial for home-buyers and a useful tool for neighborhood planners as well. For this reason, knowing how to design a cul-de-sac in 3D is a necessity for any construction design professional.
How Are Cul-De-Sacs Modeled?
Cul-de-sacs can be modeled with any AutoCAD software just like any other type of road. Using the data collected from a detailed topographical survey, planners can create a general plan for the roadways and cul-de-sacs. From there, professionals can then combine these plans into a detailed 3d model using AutoCAD software. Models should feature the cul-de-sac road, as well as any lots surrounding the cul-de-sac.
Cul-de-sacs can be modeled in several ways, but four primary features determine the overall shape and size of the cul-de-sac:
Centerline curve: The centerline of a cul-de-sac is the centerline of the street leading to the termination. This centerline can be curved or straight, dictating the overall shape of the cul-de-sac road. The centerline curve is typically determined by the topography of the area and should be placed in a way that allows plenty of room between the road and any topographical features that will not be altered during construction.
Terminal radius: The radius of the circular terminal is the distance from the center of the terminal to each side, and determines the overall size of the cul-de-sac’s terminal. For cul-de-sacs, this radius is a minimum of 50 feet, which results in a terminal that is 100 feet wide to allow plenty of room for emergency vehicles. The radius may be wider, especially if the cul-de-sac features a center island.
Termination placement: The termination of the cul-de-sac is designed to be a circular shape, but this circular feature may be placed in various ways. A symmetrical cul-de-sac is designed with the circular feature placed straight on the end of the centerline, resulting in the traditional match-head shape of a cul-de-sac. Alternatively, a cul-de-sac can be designed with the circular feature offset up to 90 degrees from the end of the centerline, resulting in a terminal that curves to one side.
Return curves: Placing a circular shape on the end of a rectangular road will result in sharp edges at the meeting points between the two shapes, which is undesirable for road construction. For this reason, the transition from the circular cul-de-sac terminal to the road is graded using return curves.
The above features are essential to know and consider while modeling for cul-de-sac neighborhoods and will come into play during the design process discussed below.
How to Design a Cul-De-Sac
Designing a 3D model cul-de-sac in AutoCAD is the most important step before initiating construction, as it creates a detailed plan to work from that can help streamline construction and minimize costly mistakes. However, cul-de-sacs are more difficult to design than normal roadways. One of the easiest ways to accomplish this model is by starting with a square and rounding off the corners to create a circle. This is a step-by-step guide for how to create a cul-de-sac with a rounded terminal using this method:
Draw the road: First, create the road section of the cul-de-sac. In AutoCAD, this will appear as parallel lines with no clear termination. Be sure to place the road in a way that goes around topographical features that will remain in the final construction.
Terminate the road: Draw a straight centerline across the end of the road where the circular terminal will be placed. Keep in mind that the terminal will extend past this endpoint by the termination radius, so allow enough room for the radius extending past this point. Make sure that the length of this centerline matches the diameter of the cul-de-sac, and place it according to the type of cul-de-sac you want to make. If creating a symmetrical cul-de-sac, place the middle of this centerline at the end of the road’s centerline. If creating an asymmetrical cul-de-sac, offset the new centerline as desired.
Create the terminal base: Using the centerline drawn in the previous step, create a square section of road with a width that matches the diameter of the desired terminal. This should result in a square section of road that approximates the shape and size of the final terminal. At this point, double-check the placement of the road square to make sure that the terminal placement is correct. Symmetrical cul-de-sacs should be placed so that all sides of the terminal are equidistant from the centerline endpoint for the main road, while asymmetrical cul-de-sacs should be offset to one side.
Create the junction: At this point, the AutoCAD software will detect a junction and should prompt you to create the return curves for the terminal. Enter the desired radius for these return curves — these should be fairly small, but keep in mind that the smaller the radius, the sharper the curve.
Round out the terminal: At this point, you are ready to change the shape of the terminal to a circle. Use the road tools and select the section of road you have created. Depending on the software you are using, you should have the option to either change the shape all at once or to select each corner and set a radius for a curve. Make the changes according to what your software allows.
Adjust terminal placement and junctions: From here, you can change the details of the terminal to match your desired plan. This may include moving the terminal from a symmetrical to an asymmetrical placement or vice versa. You can also change the radii of the junctions to create more gradual return curves.
Add grading: Once the overall shape of the cul-de-sac is complete, you can combine this design with a topographical map or manually change the vertical leveling of the model to match the topography of the construction project.
The above guide represents a basic method for modeling cul-de-sacs in AutoCAD that practically any construction planning professional can use, with some adjustments depending on the specific software. But we have yet to address an important question about modeling for cul-de-sacs — why is it so important to model cul-de-sacs accurately?
Why Model Cul-De-Sacs?
Construction sites used to rely solely on surveyor stakes, heavy-duty equipment and quality operators, but 3D modeling has brought about significant changes in the way residential areas are constructed. 3D models for construction projects create more accurate layouts that precisely show what is needed and can identify potential problems before equipment breaks ground. This careful planning minimizes project costs significantly by reducing errors and maximizing labor efficiency. This is especially important for residential cul-de-sac construction, which is highly affected by construction costs and is significantly inconvenienced by lengthy construction periods.
On top of the cost benefits of implementing 3D models in traditional construction, 3D modeling can be used in implementing 3D model machine control. If you’re not familiar with this concept, machine control uses positioning sensors on equipment to give machine operators real-time feedback during construction. These sensors tell operators how to position buckets and blades as well as target grades, which minimizes error and maximizes construction site efficiencies. When implemented correctly with quality 3D modeling, machine control can help achieve the following:
Increased machine efficiency: By providing detailed feedback and instructions, machine control helps operators maximize machine efficiency and productivity.
Decreased operating expenses: Because the equipment is used more efficiently, construction projects require less fuel and maintenance to achieve the same results.
Minimized materials costs: 3D modeling allows for improved visualization of material usage, meaning that raw materials are used more effectively.
Reduced surveying costs: Using 3D models and sensors, the equipment provides feedback about grades to operators, reducing the need for ongoing grade checking.
Lowered labor costs: With more effective sensors, workers get real-time feedback that makes them more efficient, reducing the amount of labor needed for each project.
Minimized errors: Real-time feedback allows workers to see their progress as they go and catches errors early, reducing the need for reworking areas.
The key to achieving these benefits for cul-de-sac projects, however, is using complete and accurate 3D models. This is why construction companies are increasingly choosing 3D machine control modeling services to help with their neighborhood construction projects. If you’re looking for quality modeling for cul-de-sac projects, Take-Off Professionals can help.
At TOPS, our specialty is preparing 3D data models for construction sites of all types. With over two decades of experience providing 3D models for the construction industry and a talented team of engineers and technical staff, we have what it takes to transform your data into what you need to achieve your goals. We produce approximately 1,000 machine control models a year, and our clients can attest to our accurate, timely and detail-focused service. Best of all, TOPS has engineers working in all major U.S. time zones, providing timely service across the nation.
In addition to our high-quality service and staff, TOPS provides a unique platform for our clients to upload all their project files, notes and related documents. With this secure and user-friendly program, our clients can communicate with us effectively while still being able to focus on their core business. It’s all part of our dedication to a hassle-free client experience.
Contact TOPS today to learn more about the benefits of our services and how we can help with your next residential construction project.
Mass haul refers to a calculation that multiples the volume of material with the distance that it’s transported during construction. It’s commonly used in construction and civil engineering projects as they often involve excavating and moving large amounts of earth. A mass haul movement is the transportation of this material from its original location to where it’s going to be disposed of, treated or used.
Deciphering Mass Haul Diagrams
A mass haul diagram provides viewers with a graphical representation of the material moved. In particular, the diagram will showcase the amount of material that’s been transported along the centerline. It also displays the distance that the materials travel while being transported. In this diagram, you can often see grade points, overhaul and free haul regions and balance points.
Some of the key terms you should know to read a mass haul diagram properly include:
Haul: A haul refers to the transportation of your project’s excavated materials. The haul includes the movement of material from the position where you excavated it to the disposal area or a specified location. A haul is also sometimes referred to as an authorized haul.
Overhaul: When you get authorization to haul material farther than the original free-haul distance, the transportation of said material is called an overhaul.
Free haul: A free project’s average haul is referred to as a free haul.
Average haul: You can find the average haul using the mass diagram. The average haul is a specific area in a mass diagram. It represents how many cubic yard stations are between balance points divided by the ordinate of mass that the yardage gets hauled.
These diagrams are crafted using a mass haul view and a mass haul line. The mass haul view refers to the grid where the mass haul line is placed. The mass haul line refers to the overhaul and free haul volumes in fill and cut conditions that run along an alignment.
A project is in a cut region if the mass haul line rises. In contrast, if the mass haul line drops, the project is in a fill region. The diagram’s grade points and balance points will mark mass haul regions. Essentially, the mass haul line’s position in relation to the balance line shows viewers the movement of material.
On these mass haul diagrams, you can compare overhaul volume and free haul volume with the project’s grade points and the balance points.
Achieve Exceptional Mass Haul Analyses With Us
Looking for unparalleled assistance with mass haul diagrams? TOPS’ experts deliver insightful Earthwork Takeoffs featuring cut/fill maps and mass haul analysis. Prevent mistakes, avail consistent services, harness cutting-edge technology and tap into expert staff with TOPS!
Grade points are stations on a mass haul diagram that shows when a project design shifts from cut to fill. A grade point will reveal the lowest or highest point in a region of a mass haul. When the grade point in a mass haul region is the highest point, it represents where the project’s profile switched from a cut condition to a fill condition. The opposite occurs when the grade point is at the lowest point of a mass haul region. At this lowest point, the profile goes from a fill condition to a cut condition.
To measure free haul using grade points, you draw a horizontal line that is long enough to cover the span of the particular free haul distance. The line is placed so it contacts the mass haul line and runs parallel to the diagram’s balance line. The free haul is the volume of the area that’s inside the mass haul line and the horizontal line.
Identifying Balance Points in Mass Haul Diagrams
On a mass haul diagram, balance points refer to the stations where the fill volumes and the net cut are equal. These balance points can be found on the diagram’s balance line. More specifically, the balance points are stations where the net volume equals zero on the line.
To measure free haul with balance points, begin by duplicating the mass haul line and move horizontally. The distance it moves will be based on the free haul distance. If the project goes from cut to fill, you’ll shift the balance point to the right. You’ll move the balance point to the left when the project goes from fill to cut.
The Practical Applications of Mass Haul Diagrams
Mass haul diagrams are primarily used to provide a more accurate representation of the materials being moved. They give viewers key information about free haul, average haul and overhaul. For instance, you can calculate the free haul between specified balance points. Besides just finding the free haul between two points, you can find the free haul of the whole project.
They also have the very practical use of telling professionals and contractors the way project material needs to be transported. The diagram can showcase how much dirt a project needs to move. If you’re doing a significant amount of excavation or filling, the information that mass haul diagrams can provide is invaluable.
Additionally, you can use these diagrams to compare different proposals. Since contractors and designers can better understand where gross material movements will occur, these diagrams are perfect for showcasing how different designs approach the project. An accurate representation of the material needing to be excavated and hauled can help a company create an accurate quote for a potential client.
Optimizing Road Construction with Mass Haul Diagram Calculations
One of the major ways that mass haul diagrams are used is to assist with roadway design. Mass haul diagram calculations and drawings are crucial to helping designers find out how much earthwork is needed for a project. The earthwork that gets calculated takes into account the needed fill material to construct a roadway’s embankment and the existing earth material.
The ordinates on the mass haul diagram will be the sum volume of embankment and excavation. As such, road designers will hope that the initial ordinate is equal to the final ordinate to ensure the volumes of the embankment and excavation match. Designers use the diagram to make sure the total volumes of the embankment and excavation match.
If a designer notices that the initial ordinate is less than the final ordinate, the project has too much excavation. For projects where the initial ordinate is greater than the final ordinate, the embankment’s volume will be higher than the volume of materials you have to complete the embankment. This discovery will signal to a construction professional that they need more materials to complete the project.
During a highway construction project, these calculations are especially helpful. Construction professionals can use the calculations to balance the total amount of fill and cut of the highway project. By balancing them, contractors prevent having to spend extra money hauling more materials.
Delving into Mass Haul Analysis: Understanding the Basics
A mass haul analysis is a feature often included in mass haul software. This type of analysis allows users to determine the haul distance and volume of a project’s net fill station ranges and net cut groups. To minimize the total volume-distance transported, a mass haul analysis program can calculate the best cut to fill movements.
Crafting a Mass Haul Diagram: A Step-by-Step Guide
Making a mass haul diagram starts with gathering a list of materials. Next, you need to have a simple line group and an alignment. On the x-axis, you’ll graph sample lines, which are sometimes referred to as stations. On the y-axis, you’ll graph your cumulative material volume. This cumulative material is usually earthworks. The balance line takes the form of a middle axis line, standing for zero cumulative volume.
There are a few different mass haul diagram software programs on the market that can help you generate a diagram. They each have their own processes for creating mass haul diagrams. These programs should allow you to do a mass haul analysis to see if you’re moving the needed amount of material, among other factors. For example, Autodesk’s mass haul diagram program, Civil 3D, is popular in the industry.
Financial Advantages of Utilizing Mass Haul Diagrams in Projects
Haul plays a significant role in determining the cost of conducting any earthwork for a project. A contractor or construction professional will need to create a bid price based on their estimation of their rate of haul, the equipment they need to transport a haul and the total amount of material that’s going to be hauled. By knowing information about the equipment you need and the rate of haul you can provide, you’ll ensure you cover your costs and make a profit.
One of the most important stats you’ll need to understand before you estimate your haul costs is the rate of haul. To get this information and the total haul, you should know where the project’s gross material movements happen at the worksite. As you attempt to determine this information, you can use a mass haul diagram.
An accurate and detailed mass haul diagram will give a company the information it needs to estimate the project’s total haul. For one, the mass haul diagram will indicate whether there’s a deficit or excess of material at various points in a project. The diagram also should give you a visual representation of the project’s cut and fill material. Detailed diagrams will also use curved lines to show how the material is moved during the project’s lifecycle.
With all of this information from a mass haul diagram, a contractor can figure out the most cost-effective way to complete a project. Since you won’t include the amount of material taken from borrow sources in the mass haul diagram, you can get an accurate take on your on-site materials and figure out the most cost-effective way of completing a project. In this evaluation, you can decide on haul, grading limitations, borrow source location, existing material placement and scheduling concerns.
The Strategic Value of Data Modeling Experts in Mass Haul Planning
Mass haul diagrams are crucial for any time you need to transport materials on a job site. Working with Take-Off Professionals (TOPS) means you have Data Modeling Experts in your corner to assist with mass haul diagrams and analysis. We’re proud to provide our clients with Earthwork Takeoffs that feature cut/fill maps, dirt and material quantities and mass haul analysis for roads and sites. Along with offering these services, we also can create haul roads for your project’s entire life cycle.
There are many benefits to working with the data modeling experts at TOPS. Some of these advantages include:
Prevent mistakes: With our team in your corner, you get peace of mind. We’ll comb through your mass haul diagrams and ensure that there aren’t any problems. It can be a real headache if you realize you haven’t accounted for enough material once a project is already underway. Trust us to examine the details of your data to prevent mistakes from impacting your project.
Consistent service: You want someone you can trust in your corner. Your company may have a consistent style for diagrams, or you may need services completed quickly to keep up with your project’s demands. We’ll build your data in the exact way you require it, making it easy to read and in a form you understand. Additionally, you can trust us to keep up with your pace.
Cutting-edge technology: Staying up to date on the latest technology is absolutely vital in our industry. We’re always up to speed on the latest software and are continually improving our services. To prepare for every job, we consistently use four different kinds of software. We also have a broad range of experience with different programs, meaning we can use the best package to deliver exceptional results.
Expert staff: Our staff is filled with a variety of experts, from operators and grade setters to surveyors and engineers. They all have experience in their respective industries and can lend their expertise to different aspects of the project.
Focus: Our company focuses on data. We’re not here to sell you supplies, software or equipment. Instead, our only goal is to optimize your data and perform industry-leading takeoffs. This level of focus means we can devote all of our efforts to taking your data analysis to the next level, especially when it comes to evaluating a mass haul diagram.
Enhance Your Project with Take-Off Professionals’ Expertise in Mass Haul Diagrams
Check out our many services to find one that works for you. If you’re interested in a mass haul diagram analysis, contact us today to discuss your options.
New technologies are always disrupting the construction and civil engineering industries. Point cloud modeling has existed for a while, but it’s becoming a major tool for contractors and engineers who seek more ease and efficiency when conducting land surveys. It accomplishes the same work with fewer resources spent — which is what every person wants from their business endeavors. But what exactly is a point cloud, and how does it help with surveying work sites? If you want to learn how to use a point cloud for 3D models, this article can show you how it works — plus what you can gain from it.
Unveiling the Basics of 3D Point Clouds
A point cloud is a collection of many small data points. These points exist within three dimensions, with each one having X, Y and Z coordinates. Each point represents a portion of a surface within a certain area, such as an engineering work site. You can think of these points similarly to pixels within a picture. Together, they create an identifiable 3D structure. And the denser your point cloud is, the more details and terrain properties you’ll see within your image. Creating and utilizing a point cloud puts a world of data within your reach, but you must know what to do with it after you generate it. This question can pose a problem for some surveyors — and others may not know how to create a point cloud to begin with. However, both of these problems have easy solutions. When you outline the goals you want to achieve from using a point cloud, you’ll know how to obtain your data and get the most value from it. You can create point clouds by using two primary methods — photogrammetry and Light Detection and Ranging (LIDAR), which we will discuss in more detail below.
Elevate your Engineering Project with Top-Notch Point Cloud Modeling
Leverage the power of point cloud modeling for your next engineering project with TOPS. We offer services such as point cloud services, mesh conversions, and more to aid your data processing challenges. With us, save more money, and finish tasks efficiently by avoiding costly errors.
How do you create a point cloud when it involves so much detail and so many small points? The answer is typically a laser scanner. Site surveyors can create 3D models from point clouds by using LIDAR lasers. With the laser, you scan a chosen environment — such as a construction site — and the scanner records data points from the surfaces within it. Once you have the complete point cloud, you can import it into a point cloud modeling software solution. At this stage, you can modify the data points for better accuracy. To see the point cloud in a 3D format that resembles your terrain, you’ll need to export the data from your modeling platform and upload it into a computer-aided design (CAD) or building information modeling (BIM) system.
Capturing Reality with Photogrammetry in Point Cloud Surveys
Photogrammetry is a common method for creating point clouds. With this technique, a drone takes numerous pictures of a construction or civil engineering site. Because the drone uses a camera, you’ll likely need to adjust its settings for the site’s environmental conditions to get the best results. Various angles are required to capture a full view of the landscape. Once all the images are captured, you can use a processing platform to overlap the photos. By stitching the images together, you can develop a point cloud, create a 3D mesh and produce a complete 3D model within a CAD or BIM program. The process of filling in the gaps between the data points and creating a mesh is known as surface reconstruction. That’s why it’s essential to get as many data points and images as possible — you’ll have fewer spaces to fill in or reconstruct. In contrast to photogrammetry, remote sensing — which is what LIDAR is categorized as — uses aerial vehicles to study a work site and create data points from it in real-time.
LIDAR Technology: A Deep Dive into Point Cloud Acquisition
With the help of drone technology, you can use LIDAR to scan an area and record its data points to produce a point cloud. LIDAR uses infrared light laser pulses to measure distances. When these pulses reflect back to the sensor, it measures how long it took for the light to return. These laser scanners can emit up to 100,000 pulses per second, which gives an incredibly detailed view of the area being mapped. Once you’ve created your LIDAR point cloud, it goes through a similar process of being transformed into a mesh and developed into a 3D model. Mounting LIDAR hardware onto a drone allows you to use 3D laser scanning to map any area you choose. Attaching the hardware correctly is essential — incorrect setup can impact the drone’s balance, which affects your data’s accuracy. LIDAR and photogrammetry produce similar levels of accuracy. When choosing which one to use, it’s better to consider factors like how long it takes to set up the equipment and which method will be easier for you to work with.
Point Cloud Application in Modern Site Modeling
What is a point cloud in surveying? Land surveyors use point cloud modeling to create expansive representations of landforms where it would otherwise require tremendous time and effort. Even if your project isn’t huge, using LIDAR drones to collect data increases your efficiency and overall work experience. Civil engineering sites can consist of roads, subways systems, bridges, buildings and more, which can have complex structures. Surveying these locations manually can stretch out a project’s duration and require a bigger budget, but technological advancements like point cloud modeling streamline the process. In general, new technology has significantly impacted civil engineering within the last few years. Additive manufacturing, smart tech and artificial intelligence are just a few examples. Drone technology and point cloud modeling could also become essential elements of the connected job site. Tasks like geolocation, transferring as-built information and remotely monitoring work sites can all benefit from these two technologies. In turn, companies can improve employee productivity and safety and reduce their insurance and liability costs.
Utilizing Point Clouds for Precision in Earthworks
Point cloud modeling techniques use drones, which have become increasingly popular for earthworks and construction projects due to their flexibility and efficiency. They can fill multiple roles within the building process — from the beginning to the end of any project. Mining, surveying and agriculture are among the many industries that have adopted drone technology for process optimization. Here are a few ways that drones have shaped modern earthworks jobs so far:
Improved progress monitoring: Companies that commission earthworks projects don’t always have the time or resources to send people out to their sites to conduct regular checks. Drones enable them to inspect the progress by taking photos of the site and turning them into an orthomosaic. From there, they can use the orthomosaic to create a digital elevation model (DEM) and compare these daily shots to their final project plans.
Better worker safety: Manual surveying may require workers to walk up and down steep slopes or through rough terrain, which can prove dangerous if someone falls. If you put a drone in the field instead, you can capture data from afar without the injury risk.
Quicker cut-and-fill: Some companies use topographic surveys to do cut-and-fill comparisons, which can take days to perform on a large or complex work site. Processing the data adds more time to the schedule — but drones can accomplish data collection at faster speeds. Processing, importing and exporting this information using intuitive software becomes simpler.
Transforming Point Cloud Data into 3D Models
Constructing a 3D model can change in complexity depending on the building or landscape type and its features. Renovations or retrofits that must be done while the area is still in use add another layer of intricacy, but they are not impossible to do with the right tools. Laser scanners and high-tech modeling software solutions ensure that every possible object is identified and distinguished from the next. For landscapes with complicated or richly vegetated terrain, it may be necessary to send a surveyor out to supplement any spots the scanner might miss. When you have your data points and begin the conversion from point cloud to 3D model, you’ll likely have more than one scan to work from. Similar to photogrammetry, you’ll need different angles of the same site to get the full picture. Rendering the data into a 3D mesh organizes the points and sets a foundation that you can use to build a model. Exporting the point cloud creates a file that can be imported into a CAD or BIM system. What are the common point cloud formats? Depending on the software you use, you might see file formats such as:
PTS: PTS is an open format for 3D point cloud data. Because open formats are maintained by standards organizations, anyone can use them.
XYZ: XYZ is an archetypal American Standard Code for Information Interchange (ASCII) format. It’s compatible with many programs, but it has no unit standardizations, which can make data transfer more difficult.
PTX: This is another common format for storing point cloud data, usually from LIDAR scanners. It can only be used on organized clouds — no unordered ones. It’s also an ASCII format.
E57: This file format is vendor-neutral and compact. It can store point clouds and metadata from 3D imaging systems — like laser scanners. It’s also specified by ASTM International, with documentation in the ASTM E2807 standard. Additionally, it can store properties connected to 3D point cloud data, such as intensity and color.
LAS: This open format is designed for data obtained from LIDAR scanning, though it can also accommodate other point cloud data records. It combines Global Positioning System (GPS) data, laser pulse range information and inertial measurement units (IMU) to create data that fits on the X, Y and Z axes.
PLY: Known as the Polygon File Format, this type stores data from 3D scanners. It accommodates properties such as color, texture and transparency. It can contain data from both the point cloud and the 3D mesh.
Whichever file format you decide on, make sure your modeling software can convert your point cloud into one that’s compatible with your chosen CAD or BIM solution.
Advancing Projects with Point Cloud Modeling: The Strategic Advantages
Point clouds aren’t the only way to create 3D models, but they are incredibly beneficial for numerous reasons. Construction managers and civil engineers use 3D models for better machine control, improved accountability with project progress and true-to-life site layouts. Some of the perks of modeling include:
Boosting Efficiency Through Point Cloud Technology
Uploading your point cloud into a photogrammetry platform lets you organize the data without the hassle of triangulating every point on X, Y and Z manually. The software does the work for you, which saves you hours of time you would have otherwise spent manipulating data. With these hours shortened, you can pull together the project details more quickly and begin your work sooner — which also means faster completion time. Data collection is also faster because of the large number of points that can be recorded at once. A drone can sweep an expansive area in much less time than it would take for a surveying team to do the same.
Achieving Precision with Detailed Point Cloud Models
Laser scanning and photogrammetry give quick and accurate results, transforming a living landscape into a detailed 3D model. Ground-based LIDAR can yield results that are accurate within a millimeter scale, while drone-based LIDAR is accurate from 1 to 30 centimeters. Its lasers can penetrate through dense vegetation for a more comprehensive site view. Additionally, LIDAR often incorporates other features like GPS survey technology to ensure each data point comes with accurate information. Photogrammetry, too, uses Real Time Kinetic (RTK) geo-tags to ensure accuracy in recording the landscape’s form.
Cost Savings: The Financial Impact of Point Cloud Modeling
Because of the greater precision involved in site mapping with point clouds, you can plan a more effective budget for your projects. You can avoid going over your financial limit, and you’ll have fewer chances of running into any costly mistakes or unexpected expenses. Laser scanning also eliminates the need for manual surveying, which reduces the cost of hiring additional labor. You’ll save money with these decreased or eliminated expenses, but you’ll also earn more on your projects. Your increased accuracy levels can lead more clients to trust you with completing their assignments, which boosts your reputation and encourages more companies to do business with you.
Partner with a Specialist for Expert Point Cloud Modeling Services
If you’re ready to incorporate point cloud modeling into your next engineering project, work with the experts at Take-off Professionals. We perform point cloud services and mesh conversions to help you process your data. Whether you’re working with a progress takeoff or an as-built, we can work with your information to provide the personalized results you need. Working with a data modeling expert can help you save more money on your projects and finish tasks more efficiently. Conversion and processing require expertise and a fine-tuned eye for detail, which can lead to time-consuming mistakes if done on your own. By enlisting the services of our trained technicians, engineers, and surveyors, you’ll receive results that have been refined by over 20 years of operation. Fill out our form to learn more about how we can help you with your next job, or call us today at 623-323-8441. We do projects big and small, whether your point cloud consists of one construction site or acres of land.
For many years, our business has been centered on the production of 3D data modeling for machine control. This is the low hanging fruit of a civil site. High dollar paving, building pads, and retentions are easier to do and higher quality with machine control. Fast forward to current times.
Many civil sites are being completed with machine control. The use of machine control on the job site has become a reality, to the point that contractors have started to look beyond their current use and possibilities. As many of you know, I have long been a proponent of leveraging data for a job site. I have worked with many of our clients on how to better use the data they have in their hands and drastically improve production and profits.
I will go over several ideas that are good next steps for users of 3D site data. They are in no particular order of profitability. Any site may or may not be able to use these processes. Not to worry, I will back up the explanations with a video to better explain these ideas.
2D and 3D Points
Considered the domain of survey, a point has specific and relative information. I’ll use points for laying out a curb arc as an example. 3D points for the PC and PT of a curb arc give us the location and elevations of that curb run. We know the slope between the points and paving elevation is an easy calculation. Next, we add the arc center as a 2D point. Now there is a pivot to swing an arc for form or string line layout. Increasing the power of points, we offset the curb line to allow the field to set string line for a curb machine.
Site Layout
Using earth moving equipment to get the dirt right is a huge time saver. We also advocate the use of positioning technology for more than grading.
Electrical
It started with light pole bases and quickly escalated from there. We now regularly provide data as 2D or 3D points for the following.
SES pads. The job has been checked so we are good with drainage and elevations on the site. The electrical service slab is easy to calculate from available regulations.
Common area in-ground power. Many plaza shopping centers have electrical connections for decorations and kiosks. Knowing the 3D location of the connections allows electricians to easily set them right the first time.
Common area hardscape. Everything from playground equipment to benches, these additions need some type of base and connection. It is best to know what can be accomplished while access is easy and save re-digging to set later.
Utilities
We have been providing utility layout for years. We show points 10 feet apart on the flowline for pipe with horizontal offsets if needed. Structures are marked as well. The advent of successful machine control for excavators has allowed us to provide a trench network so the operator can dig trenches correctly the first time.
Other utility details that can benefit from information provided in the data are:
FES’s, wing walls and valley gutters. These concrete structures are better done in rough grade, but many contractors wait until near the end of construction and field fit. With a correctly prepared model there is enough confidence to build these when it’s convenient to the crew.
Water lines are usually specified as a minimum depth below finish grade. We build the line in the data so crews can place it at any time and not make a mess of the just completed grading with required wheel trenching.
Subdivisions have utility connections for each lot which we handle one of two ways.
We can layout all the laterals and they are placed according to plan. When it’s time to make the connection, the rover is used to find the location of the pipe.
When the utilities are not well defined or connections have to move, as-built shots are taken and we update the model for easy use in the future.
As-Builts
Taking shots along the way provide an ongoing record of what is being done. This helps to establish production rates as well as the basis for future submittal drawings. Here is one way to bring this into your workflow.
I call this the “daily topo walk around.” While reviewing the work being done on a site, the superintendent has a rover and takes ground topo shots as well as items being put in the ground. In a perfect world, points would be coded but that is not critical.
We often are asked to convert the walk around topos into as-builts or progress takeoffs. With the model on the screen overlaid to the topo points, we can usually figure out what the shots represent.
Utilities are the biggest winner with as-built points. Before covering, if the top of pipe is measured, those are later converted to as-built drawings we put together for closing submittals. Many contractors have an issue with this, and we get it. It’s one thing to get the points but now the office needs to do full blown CAD drafting and plotting.
I will help to tie these ideas together in a video linked HERE. Please don’t hesitate to ask any questions you may have regarding these or other issues.
Update May 2020
All the things I discussed above pale in comparison to the big picture of data we strive for. All these elements are time savers and money makers, but they lead to the overarching point that data must be moved efficiently and used by everyone to be successful.
Let me follow some enhanced data through the process so you can see what needs to happen. In this example, I will work with the installation of a deceleration lane and entry to a commercial site.
Office
Plans are reviewed and data built to existing grades shown on the plans.
Model works well with the information we have.
I note the entry and ask the field to get measurements of the paving at the sawcut line.
Field
Site is set up and work starts.
When appropriate, the field shoots paving elevations for the entry.
The field notices the elevations are not matching with what they have on their model. The road is higher than what the model says it is supposed to be.
Shots are sent to the office.
Office
I take the shots from the field and compare to the plan version of the existing conditions.
I make the adjustments to the surface and entry elevations to line up with what is there. I do not want to design the entry, but I want to present a solution to the engineer if possible. Never ask a question you do not know the answer to.
Information is sent to the engineer for collaboration.
Engineer approves the changes. Always make sure you get this in writing such as email. Phone approvals will come back to bite you, don’t ask how I know.
Model is updated and sent to the field.
As I have outlined here, the depth of 3D data is realized only when it is shared and leveraged by all parties. Share the information with engineers and surveyors to improve the quality and speed of the project. Everybody wins when you give out good data.
The processes involved with building roads, railways and canals often involve adding or removing large masses of dirt and stone. This addition and removal of mass is called cut and fill in the excavation industry. Cut and fill is a common process where the movement of the earth is handled in a logical manner.
The goal of cut and fill is ultimately to conserve energy and maximize the use of existing materials to avoid bringing in or shipping out dirt mass. While common, it can be an exhaustive process — moving earth takes a great deal of labor, and mistakes can lead to costly rework. To avoid such problems, project planners use detailed and intelligent cut and fill maps, providing exhaustive plans to help guide excavation teams to the most efficient use of mass and labor.
Maximize Your Cut and Fill Projects With Us!
Planning critical cut and fill projects? Let Take-off Professionals guide the way! Our diverse data services and 3D models can transform your terrain data into meaningful insights for optimal terrain utilization. Whether you employ Carlson, Leica, Topcon, Trimble, Civil 3D, MicroStation or any design software, our expertise can cater to your needs efficiently.
So what exactly does cut to fill mean? Cut and fill excavation, also known as excavation and embankment is the process where excavators move and place volumes of material to create optimal terrain for a road, railway or canal. It involves cutting away unwanted earth material and topsoil and using it to fill and create an embankment, slope, or another feature.
The two terms are defined as follows:
Cut: Earth that is removed from an area is considered “cut” or excavated earth.
Fill: Earth that is brought into an area is considered “fill” or embankment earth.
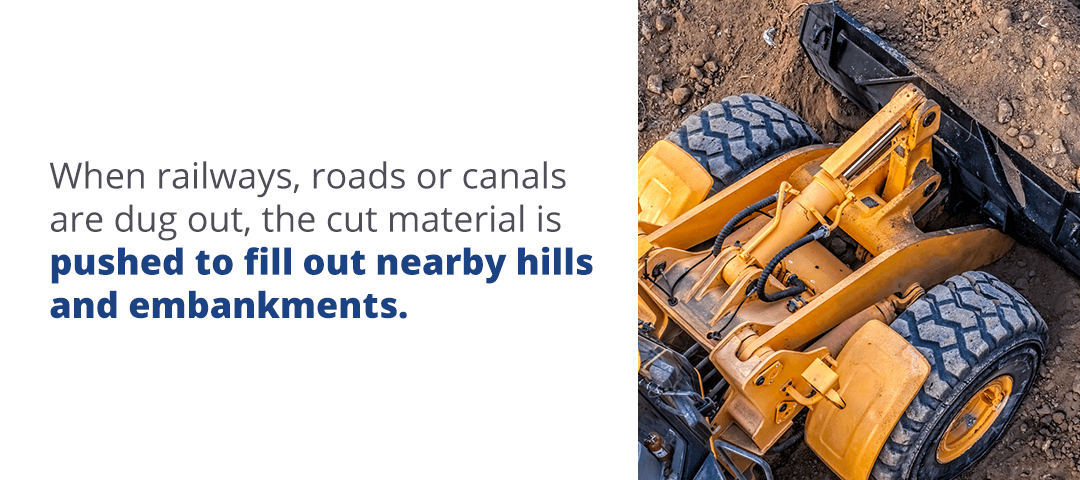
When railways, roads or canals are dug out, the cut material is pushed to fill out nearby hills and embankments. This process is usually accomplished with earthmoving equipment. Bulldozers and excavators remove land from cut locations and transfer it to dump trucks, which carry it to fill locations. Once the land is transferred to the fill location, the filled earth is compacted with a roll-style or plate compactor.
This compacting process removes air before any construction takes place. It’s essential, as it prevents the earth from moving and settling during or after the construction process, which can damage the foundation and building features.
In cut and fill excavation, the ultimate goal is to conserve mass as much as possible. Having more cut than fill results in project managers needing to find somewhere to dump excess rock and soil, while having more fill than cut results in the manager needing to bring in dirt from another location. Both of these outcomes result in extra material, labor and equipment costs. To avoid bringing in or removing excess mass, cut and fill processes are planned in a way to keep cut mass and fill mass approximately the same.
While effective at conserving mass, cut and fill is an expensive process. The cost of this kind of excavation increases as more land is moved and more equipment and labor are needed to do so. To help maximize the use of earth, equipment and labor, site planners often use what is called a cut and fill map.
How Are Cut and Fill Maps Used?
When they’re planning areas where cut and fill is required, designers create drawings called cut and fill diagrams. These diagrams illustrate all the areas where cut or fill are required. Such maps are generated by taking highly precise measurements of the existing topography and elevation, then overlaying a map of the desired topography. In these maps, cut and fill are defined as follows:
Cut: Areas where the existing elevation exceeds the desired elevation have the “cut” material.
Fill: Areas where the existing topography lies below the desired elevation line are the “fill” spaces.
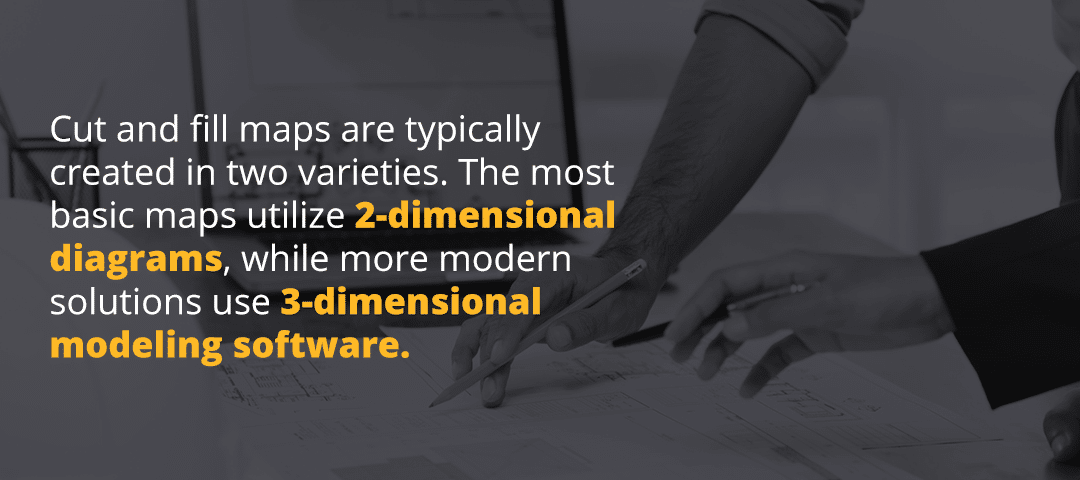
Cut and fill maps are typically created in two varieties. The most basic maps utilize 2-dimensional diagrams, while more modern solutions use 3-dimensional modeling software. These two options are explained in more detail below:
2-dimensional diagrams: At their most basic, cut and fill diagrams show a location along an X-axis with a positive or negative Y-axis, quantifying the amount of cut or fill with a negative or positive number, respectively. Since land exists in three dimensions, these diagrams must be created for multiple cross-sections of the landscape at regular intervals.
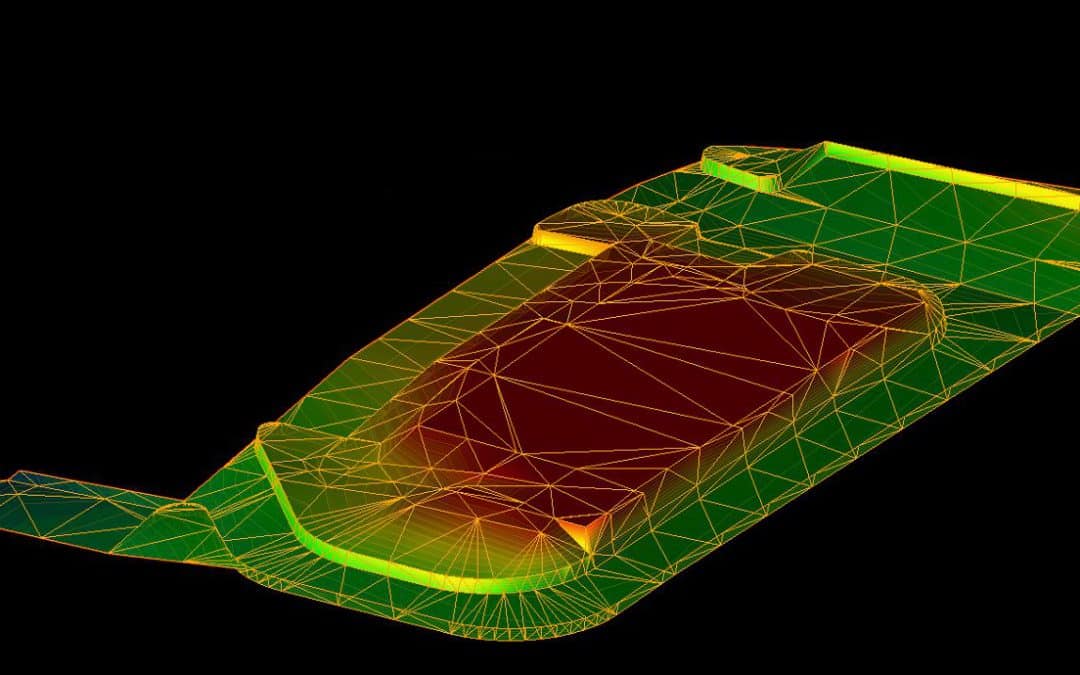
3-dimensional diagrams: 3-dimensional maps are more modern solutions for cut and fill excavation projects. The terrain is first measured using accurate surveying equipment, and the data points are used to create a software-generated model of the terrain. Once the base model is complete, the planner creates a model of the desired terrain and lays it over the existing terrain model to identify the cut and fill areas in three dimensions. Software models may highlight cut vs. fill areas with different colors that vary based on value ranges.
Choosing to use a 2-dimensional model over a 3-dimensional one should depend on the level of accuracy required for the project. Smaller-scale projects with limited cut and fill needs may not require more than 2-dimensional diagrams. Larger and more expensive projects, however, will usually require the accuracy provided by a 3-dimensional diagram. Beyond this difference, the ability to use one type of diagram over another depends on access to the site and equipment availability.
Terrain Features in Cut and Fill Maps
Cut and fill maps contain many of the same terrain features as traditional maps, though they often also include elevations for the purpose of calculation. Some of the common terrain features included in cut and fill maps are detailed below:
Hill: A hill is defined as an area of elevated ground where the ground rises at a slope. Hills are shown on maps using contour lines that form concentric circles. The closed circle that’s smallest represents the hilltop.
Saddle: A saddle is a low point between two points of high ground. It may appear as low ground between two hills or a break or dip along a ridge crest. This feature is typically represented on the map with an hourglass shape.
Valley: A valley appears as a long groove in the land and usually contains a stream or river flowing through it. On a map, valleys are usually represented by contour lines in a U or V shape with the closed end pointing upstream. Draws are less prominent versions of valleys and are notated in the same way.
Ridge: A ridge is an area with steep slope and high ground on one side. Usually, ridges will be shown with contour lines forming in a U or V shape with the closed end pointing away from the higher ground. Sometimes, spurs form from ridges, appearing as continuous lines of higher ground jutting out from the ridge. They’re noted similarly, though they may affect the shape of the ridge.
Depression: Depressions are low points or sinkholes in the ground. Maps usually show depressions only if they are significant enough in size, and these features are notated by closed contour lines with tick marks pointing to lower areas.
Cliff: A cliff is a sudden drop-off, appearing as a vertical or near-vertical change in elevation. Cliffs usually appear as contour lines being drawn extremely close together or on top of one another.
From the complete map, cut and fill can be planned around existing topographical features. Commonly, a map with these features may be used as a base, with the final project laid over it to determine areas of potential cut and fill. Once initial plans are made, cut and fill plans are added based on the topographical features.
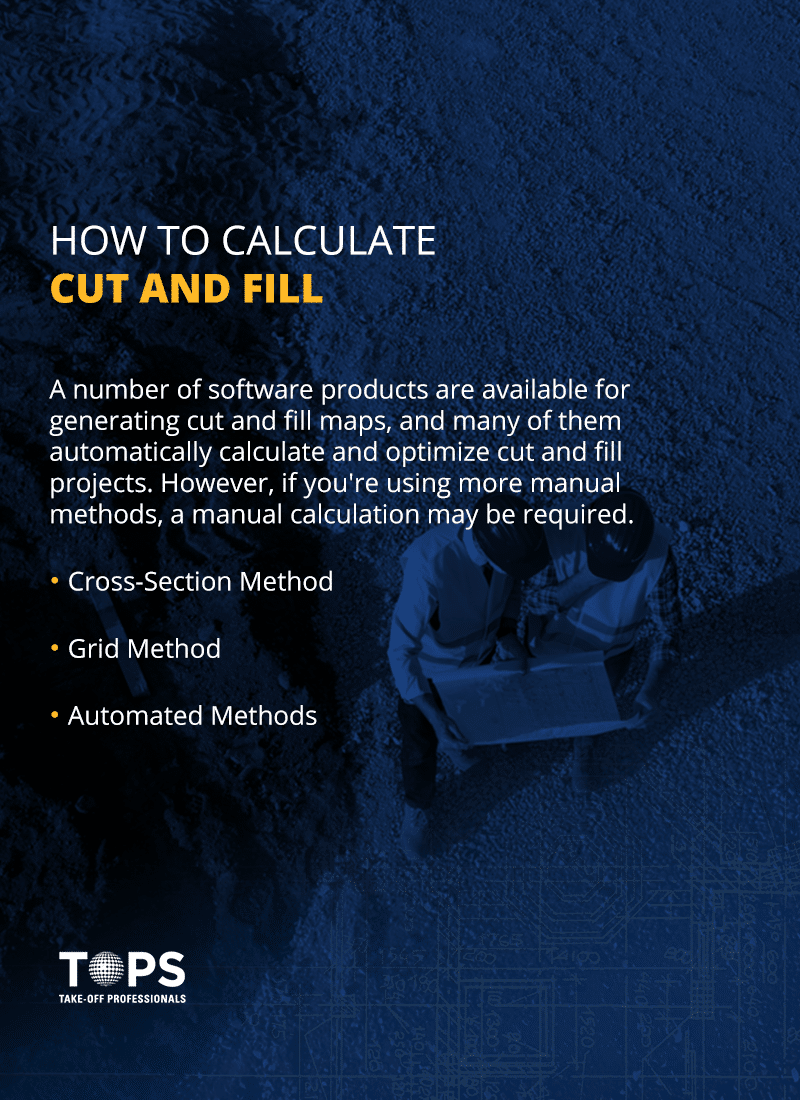
How to Calculate Cut and Fill
So you’ve determined that you’ll need to use cut and fill excavation in your project, and you have an idea of what method you’ll be using. How do you calculate cut and fill area so that you can plan out the labor and calculate your project costs? The calculation method depends largely on the method you’ll be using in your project.
A number of software products are available for generating cut and fill maps, and many of them automatically calculate and optimize cut and fill projects. However, if you’re using more manual methods, a manual calculation may be required. A variety of calculation methods are used to calculate cut and fill values, and some of these methods are detailed below.
1. Cross-Section Method
The cross-section method of calculation is a common method used with the 2-dimensional method of mapping. With this method, cross-sections of the existing and proposed land levels are measured at regular intervals across the site. The cut and fill area is determined for each cross-section, then adjacent cross-sections are compared and the averages of their cut and fill areas are multiplied by the distance between them. This is done for each adjacent pair of sections, then the total volumes are added together to create the complete cut and fill volumes for the project.
The cross-section method of calculation is considerably more time-consuming than automatic methods of calculating volume, and the accuracy of the method depends on the distance set between sections. Closer sections result in greater accuracy but take longer to calculate, while further sections are less accurate but take less time to calculate.
2. Grid Method
The grid method of calculation involves drawing a grid onto the plan for the earthwork project. For each node of the grid, determine the existing and proposed ground level and calculate the cut or fill required. Once the cut or fill depth is calculated, multiply the value by the area of the grid cell. Do this for each square of the grid, then add the volumes together to determine the total cut and fill volumes for the project.
Like the cross-section method of calculation, the grid method takes time to implement and is significantly more time-consuming than any automatic systems. Additionally, the accuracy of the grid method depends on the size of the grid cell. Larger cells take less time to calculate but are less accurate, while smaller cells are more accurate but take more time to calculate.
3. Automated Methods
If you’re using an earthwork software, you may not need to use one of the manual methods above. Instead, the software will run the calculations for you. It should be noted that these software systems are faster but not inherently more accurate — for example, some software calculations are based on high-density versions of the cross-section or grid methods. However, automated systems often use more sophisticated calculation methods, such as the triangular prism method.
The triangular prism method is a common calculation method for earthworks, and it’s favored for its excellent accuracy. However, it must be completed using software due to its technical complexity.
The triangular prism method starts by triangulating the existing terrain to create a continuous surface of connected triangles. The same method is used to model the desired terrain. Once both surfaces are complete, the triangulations are merged to create a third triangulation. Once merged, the cut and fill is calculated by taking the volumes of the generated triangles and adding them together. Because of the excellent representation of both the existing and desired terrains, this method presents an excellent representation of volumes for cut and fill projects.
Technologies and Tools for Cut and Fill Mapping
When you prioritize energy conservation and resource maximization, it’s essential to use the most efficient cut and fill mapping technologies and tools. Having the right resources will enable you to accurately map your worksite and enhance your control over project results.
Various modern technologies and software applications, including 3D modeling, drone surveys and GPS or GNSS systems, generate accurate cut and fill maps quickly and efficiently. They offer the real-time data you need to make informed decisions about resource allocation, cost estimates and other project details.
3D Modeling
3D models create a detailed, easy-to-understand cut and fill map of your worksite. With realistic models of your project, you can easily and accurately complete the necessary calculations to ensure resource optimization and efficiency.
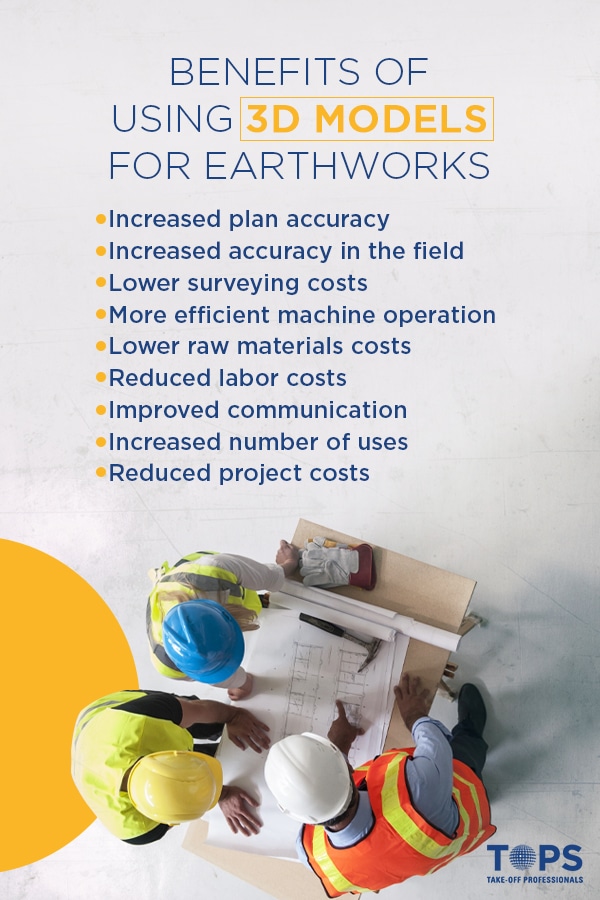
Accuracy: Using 3D models for cut and fill maps gives you a scaled replica of your worksite. You can take precise measurements of stockpiles, slopes and other essential project features to create accurate cost estimates and improve operational efficiency.
Cost savings: With 3D modeling generating your cut and fill maps, you can move earth logically and accurately according to your job site capabilities and available resources. 3D models can help reduce labor, equipment and material costs by ensuring your resources are always used effectively.
Communication: A 3D model offers a real-world visual of your worksite, providing a clear understanding of the project’s scope for engineers and clients. With a clear image right in front of you, you can communicate needs and optimize resource allocation more easily.
Drones fly at a low altitude to produce high-resolution images of existing elevation and topography. The detailed pictures they capture allow you to take accurate measurements for precise cut and fill mapping.
Using drone surveys for cut and fill maps offer several benefits, including:
Increased safety: Drones can access hard-to-reach and even dangerous areas, increasing the safety and efficiency of your workforce.
Continued operations: Since drones fly above your worksite, they will stay out of operations and away from resources so your work can continue on schedule.
Improved reliability: You can quickly and accurately gather data, map topography and measure stockpiles with a drone since they can provide visuals of multiple angles.
Saved time: Drones work faster than many other manual cut and fill mapping methods, especially since they enable you to take measurements and map out cut and fill operations from a single location while they fly over the area.
Decreased spending: With less downtime, better affordability and faster processes, drones can help you save costs on cut and fill mapping.
GPS/GNSS Systems
Global positioning systems (GPS) and global navigation satellite systems (GNSS) are valuable tools that streamline cut and fill mapping processes. Using GPS or GNSS on your worksite will enable you to:
Make informed decisions: GPS and GNSS offer accurate, real-time data, helping you make informed decisions that improve efficiency. You can experience greater precision in cut and fill mapping, cost estimations, projected deadlines and other essential worksite needs.
Save time and money: Advanced tools like GPS or GNSS allow you to make accurate calculations quickly and easily to save time and effort. Automation will help you save on labor and energy costs.
Improve safety: These tools offer increased safety since you can operate them from a distance with high levels of accuracy and reliability. This flexibility helps to protect your workforce while maintaining precision and efficiency.
Enhance efficiency: Since GPS and GNSS provide greater accuracy than some manual measurement methods, you’ll experience fewer errors that would otherwise increase costs and waste time. These tools can help optimize processes for improved productivity.
3 Common Challenges and Solutions for Cut and Fill Mapping
Exact cut and fill calculations are vital throughout every project stage. It is essential to address mapping challenges such as data accuracy, varying site conditions and slope stability to ensure your project moves forward on time and within budget. With proper surveying techniques, data validation methods and risk management practices, you can mitigate cut and fill mapping challenges and streamline projects.
1. Data Accuracy
Precise cut and fill excavation efforts will save time, reduce labor costs and improve operational efficiency, but creating the precision that cut and fill mapping requires can be challenging. Cut and fill processes rely on accurate information about topography, stockpiles and other worksite details to ensure resource optimization and seamless project progression.
Data accuracy starts with how you collect data. Modern cut and fill mapping technologies and software enable you to gather correct data from the project’s start. If you start your project with quality data, you will be better equipped to create quality results.
You can also improve data accuracy through data validation methods. When you verify the data gathered from mapping technologies and software, you can ensure information is correct and aligns with project specifications.
2. Varying Site Conditions
Worksites often have varying site conditions, especially when your project covers an extensive area. Multiple terrains, slopes and soil qualities can add complexities to cut and fill mapping and operations. Accurately mapping your worksite is essential to project success, especially when managing multiple variables.
Even if your site is relatively small or the terrain is consistent across the area, you may experience changing site conditions over time. Your worksite is susceptible to weather, erosion and other natural and uncontrollable factors, leading to varying conditions throughout the project’s duration. These variations are important to monitor and manage to ensure worksite safety and stability.
Beginning your project with proper surveying techniques will enable you to mitigate the challenges of changing site conditions. Continuing to monitor your site with the right tools and technology can also help you manage site conditions by:
Creating accurate cut and fill maps: Modern technology will precisely calculate, measure and generate cut and fill maps that account for varying site conditions.
Boosting efficiency: You can streamline operations with the right tools and technology, driving your productivity.
Saving time and costs: Using advanced tools and proper surveying techniques can save you significant time, energy and costs throughout your project.
3. Slope Stability
A stable slope can support its own weight and other external forces without soil or rock displacement. Creating this stability is essential in cut and fill operations. Aerated soil or miscalculated cut and fill slopes can lead to significant issues later in the project.
Balanced, stable and safe cut and fill slopes can be accomplished with accurate data collection and mapping. Modern tools and technology can bring the precision your worksite needs to mitigate slope stability challenges and ensure safety and efficiency.
You can also manage slope stability risks using risk management practices that improve cut and fill mapping and ensure accuracy. Consider implementing procedures such as:
Identifying risks: Brainstorm what risks your workforce could encounter when mapping cut and fill construction, collecting data, reviewing slopes, performing calculations and working safely on the site.
Assessing potential impact: Rank risks based on their impact on budgets, deadlines, slope stability and worksite safety to determine which risks require priority attention.
Preparing a response: Decide how you will mitigate each risk, such as using 3D modeling to ensure accurate calculations for mapping or drone surveying to keep your workforce safe when gathering data.
Monitoring conditions: Consistently track and evaluate project progress, especially during cut and fill operations, to ensure your workforce follows risk management practices.
Work With the Data Preparation Experts
The cut and fill process is an extremely useful process for excavation in residential, commercial and roadwork projects. However, while cut and fill makes use of existing terrain, it requires detailed planning to be as effective as possible. To accomplish this goal, project planners need detailed cut and fill maps — that means they need survey equipment to get terrain information and software to process and visualize data in a meaningful way. Take-off Professionals can help.
Take-off Professionals prepares 3D models and performs related services for a wide variety of industries, from commercial construction to civil engineering projects. Our innovative data services are available to help take your terrain data and turn it into meaningful models that you can use for your next cut and fill project.
TOPS works with a wide range of systems, so we can provide services to as many companies as possible. We work with data from Carlson, Leica, Topcon and Trimble equipment and can provide models in any format you need, whether your engineers use Civil 3D, MicroStation or another design software. We can even work with multi-brand fleets.
When you work with us, you can trust our decades of knowledge and experience as well as our innovative GPS and 3D machine control services technology. With our tools and services, your business can gain detailed insights into your project to help make the most of your cut and fill terrain.
Want to learn more about our models and how they can help on your next cut and fill project? You can get in touch with our team of data preparation experts right away by completing our online contact form or calling us at 623-323-8441.
Technology is transforming nearly every industry, and construction is no exception. One form of tech that has recently had a substantial impact on the construction industry is three-dimensional (3D) modeling. 3D models have a major role in modern construction projects, as they can improve productivity and ease of work.
3D modeling for earthworks and machine control can increase equipment operation accuracy, enhance worksite efficiency and reduce costs, among other benefits. So, how does this technology work, and how can you apply it to your next project?
Unraveling the Fundamentals of 3D Modeling
The term “3D modeling” refers to the process of creating a three-dimensional representation of an object using specialized software. This representation, called a 3D model, can convey an object’s size, shape and texture. You can create 3D models of existing items, as well as designs that have not yet been built in real life.
In construction, 3D models of a worksite can be used for machine control. These replicas incorporate the points, lines and surfaces that make up the physical environment. They use coordinate data that identifies the location of horizontal and vertical points relative to a reference point. Due to these spatial relationships, you can view the representation from various angles.
Machine control uses various positioning sensors to provide machine operators with feedback on things like target grades and bucket or blade position. The machine operators can reference the 3D model to ensure they are completing work accurately. GPS survey technology enables workers to locate the replica’s points in the field, and sensors on machines tell them where they are relative to the model’s points.
These control processes help crews translate the 3D model into reality by guiding equipment to construct the lines, points and surfaces precisely as described in the representation. Teams may also use 3D models for project, design and environmental compliance reviews. These models also help during pre-bidding, allowing contractors to test out various designs and communicate ideas.
Embark on Efficient Construction with Accurate 3D Models
With TOPS, get a glimpse into your construction project before it begins with our expert 3D models. Whether complex or straightforward, our models prepare data tailored to your needs, ensuring rapid work orders and enhanced project forethought.
The methods and technologies used today for 3D earthworks modeling would not exist without developments in civil surveying and various types of 3D modeling.
You can trace the history of 3D earthworks modeling back to ancient times. Ancient Egyptians constructed the pyramids with early surveying techniques and used geometry to re-establish farmland boundaries after flooding along the Nile River. In ancient Rome, civil surveying became a recognized profession, and surveyors created measurement systems to evaluate and create records of conquered lands.
Euclid, who is known as the founder of geometry and lived in ancient Greece, developed ideas that inspired many modern surveying and 3D modeling techniques. Many years later, in the 1600s, French mathematician Rene Descartes invented analytic geometry — also called coordinate geometry — which is foundational to 3D earthworks modeling.
Moving forward to the 18th century, European surveyors discovered they could use various angle measurements taken from different areas to identify a precise location — a technique known as triangulation. New surveying tools, such as measuring wheels, circumferentors, Kater’s compasses and Gunter’s chains, began to gain popularity. Meanwhile, English mathematicians James Joseph Sylvester and Arthur Cayley developed matrix mathematics, which is what enables today’s computer-generated images to display reflections or light distortions.
Later, surveyors began to use steel bands and invar tapes. These tools eventually gave way to technologies such as electromagnetic distance measurement (EDM) and global positioning satellite (GPS) equipment. Surveyors switched from compasses to theodolites, which measured horizontal and vertical angles using a rotating telescope. They then transitioned to using total stations, which are electronic transit theodolites equipped with EDM technology. These advancements enable them to measure both angles and distances.
Then, the first commercially available computer-aided design (CAD) systems — which turn survey data into visual representations — were released. The first 3D graphics company, Evans & Sutherland, appeared in 1968. Over the next several decades, CAD programs became more advanced and more widely available.
In the machine control field, users began shifting from the use of survey stakes — which surveyors manually set up, and machine operators read visually — to 3D modeling. Various technologies came together to enable 3D earthworks modeling, including:
CAD, which turns survey data into a 3D model.
GPS, which allows engineers to pinpoint precise locations.
Light Detection and Ranging (LiDAR), a remote sensing technology that uses a pulsed laser to measure variable distances.
Aerial photogrammetry, which enables engineers to extract topographical data from aerial photographs taken by drones.
Point-cloud modeling, which involves using laser scanning technology to create a set of three-dimensional data points used to create a model.
Innovative Uses of 3D Models Across Industries
3D replicas are a prevalent form of technology, but what industries use 3D modeling? Many sectors use 3D modeling for numerous purposes. Some concepts include:
Planning buildings using architectural visualization.
Giving 3D tours in the real estate sector.
Creating video games and movies.
Conducting academic research.
Models have several uses in construction as well, and new techniques are always emerging. Here are a few ways 3D models are used in construction:
Precision Machine Control Through 3D Modeling
3D modeling enables more accurate, efficient and cost-effective machine control. Instead of using traditional survey stakes, machine operators can see the job site on a screen while in the cab. A system of sensors guides the machine based on the 3D model’s measurements.
Equipment such as excavators, backhoes and bulldozers are equipped with on-board computers, and the blades and buckets include GPS devices. You can either set up a GPS base station at the worksite or subscribe to a GPS service. Whichever system type you choose, it will communicate with the receivers on your machines.
The 3D model is referenced to GPS coordinates and loaded onto your equipment’s on-board computers. These computers can then communicate with GPS receivers and machinery controls. As the device moves throughout the site, the GPS records where it is located at all times. As the blades and buckets on your machinery move, the GPS pinpoints their position.
The computer can automatically adjust the blades or buckets to the required excavation depths or surface elevations. This ability enables smooth, accurate grading of roads, sidewalks and parking lots and more.
Strategic Site Layout Planning with 3D Models
3D models can also be useful for communicating site layout, including the location of utility equipment and landscape elements.
You can map the location of electrical equipment, for example. That can include electrical service slabs, light poles and connections for signs, kiosks, decorations and other electrically powered elements. A 3D model helps electricians set these connections up quickly and accurately.
You can also use 3D mapping technology to map other utilities, including gutters, water and wastewater piping, natural gas lines and more. Charting the layout of utilities gives crews more confidence about their placement and provides them the information they need to place this equipment at any time.
A 3D model can also include elements such as landscaping, curbing, benches and nearly any other site feature. Accessories such as benches and playground equipment require a base and connection. Knowing where these elements will go can enable crews to prepare them earlier in the process and avoid re-digging later.
Enhancing Construction Reporting with 3D As-Builts
3D models can also be useful for communicating project progress and creating as-builts, which are revised drawings submitted at a project’s completion. You can gather new data throughout an assignment to create updated 3D models, showing what the site currently looks like. A 3D model created after a project ends can be used throughout the lifecycle of the facility for purposes such as maintenance, operations and asset management.
The Advantages of Implementing 3D Models in Earthworks Projects
Increased plan accuracy: Creating 3D models uncovers conflicts, inconsistencies and other issues in plans before construction begins, which reduces rework and costs.
Increased accuracy in the field: Because the machines have the same data the surveyor does, machine operators have an easier time following project plans. Workers won’t have to rely solely on contours when navigating a worksite. The 3D replica’s surface is also built to the landscape’s actual vertical and horizontal geometry.
Lower surveying costs: Using 3D modeling eliminates the need for ongoing grade checking, which reduces surveying costs. Having lower surveying costs can help you win more jobs and earn higher revenue over time. The additional money can also allow you to upgrade equipment and hire employees as your company expands.
More efficient machine operation: Machinery operates more efficiently becauseit moves precisely according to the 3D model’s measurements. 3D modeling helps you accomplish more with your equipment in less time. The increased efficiency also reduces fuel, repair and maintenance costs.
Lower raw materials costs: 3D modeling techniques help you hit the mark the first time around and use materials more effectively. This enhanced productivity reduces raw materials costs because you’ll need fewer supplies for each job. This benefit is sustainable and cost-effective.
Reduced labor costs: With 3D machine control modeling, many of the machine operator’s duties are automated, which helps them work more quickly and make fewer errors — this quality increases individual worker efficiency, reducing labor costs.
Improved communication: You can use 3D models to communicate project information in an approachable, visual way with various stakeholders. If everyone has a common understanding of the material, they’ll have a smoother time sharing ideas and suggestions.
Increased number of uses: You can set up the data once and then use it for various purposes, including grading, utilities and hardscaping. You can also make adjustments to the information as needed for subsequent assignments.
Reduced project costs: Using a 3D model can reduce project costs by a total of four to six percent, according to a report by the U.S. Department of Transportation’s Federal Highway Administration. In earthmoving alone, 3D models can increase efficiency by 15 to 25 percent.
To create a 3D model, you must first gather survey data. You can accomplish this by using various technologies, including LiDAR and aerial photogrammetry. The initial survey records the locations of physical features and key points, which serve as a baseline. You can then scan the area using LiDAR technology to create point cloud data models representing the physical components of a site. These point clouds combine with 3D modeling software to build the 3D representation.
When Take-Off Professionals receives the survey data files for a project, we first ensure we have all the necessary information about the job requirements and the scope of work for which our customer is responsible. We then build the 3D model based on the plans we receive. During this process, we adjust errors in the designs and take notes about potential changes.
Once we have completed the 3D model to plan, we alert the engineers to any areas of concern and propose fixes as needed. We continue to revise the model and suggest changes until every detail is correct.
CAD files: You can ship us your CAD files or upload them to our site. We can use various file formats, including industry-standard formats such as .DWG and .DXF within AutoCAD, plus numerous proprietary formats. We can process any kind of CAD package from Carlson Construction, AutoCAD, Micro Station and others.
Paper plans: We also need either physical paper plans or scans of paper plans. You can upload scanned files or send them to us on a CD. Keep in mind that it is often cheaper to ship rather than scan.
Work order: You will also need to fill out a work order, which will include details about the project’s scope. You can submit a work order through our website.
Some of the elements that may be included in a 3D model for machine control, depending on the project, include:
Parking lot surface
Roads with vertical and horizontal alignment information
Subgrade road model that extends beyond the back of the curb
Large islands and building area curbs
Small island curbs with grading
Building pads, including blow-ups if requested
Retention and sheet grading areas
2D linework of utilities or full 3D utility layout
Existing conditions
Points for the layout of objects built for the surface, such as buildings and curbs
Partner with a 3D Modeling Industry Leader
At Take-Off Professionals, we create approximately 1,000 machine control models for our clients every year. We employ a team of engineers and technical staff who are experts in building 3D models for the construction industry, and we don’t use subcontractors like many of our competitors do. We have groups working across all four major time zones in the U.S. to ensure we’re always there for our clients.
We’ve been in business for more than two decades and have established a reputation for timeliness, accuracy, attention to detail and excellent customer support. We’ve also created an exclusive platform that our clients can use to upload their files in a secure, user-friendly environment. This additional measure ensures placing a work order is fast and easy.
Learn more about how our data and modeling services can help you win more bids, reduce your costs and complete projects accurately and efficiently by contacting us today.